
Bitcoin (BTC) has surged above the $82,000 mark, gaining 5% in the past 24 hours. The cryptocurrency rallied from a local low of $76,450 to reach a high of $83,786 on March 12, following strong bullish technical signals across multiple time frames.
Key Support from 50-Week EMA
On the weekly chart, Bitcoin successfully retested its 50-week exponential moving average (50W-EMA) as support. This indicator, which BTC has remained above since August 2023, has historically played a crucial role in sustaining bullish trends.
Notably, Bitcoin previously rebounded from this trendline in September 2024 before achieving new all-time highs. The ability to maintain this support strengthens long-term bullish sentiment for the cryptocurrency.
Bullish Divergences Signal Momentum Shift
Before this recent surge, Bitcoin displayed bullish divergences across both low and high time frame charts. This technical setup occurs when the price forms lower lows while the relative strength index (RSI) makes higher lows, indicating an improving bullish momentum.
These divergences were visible across multiple time frames, including 15-minute, 1-hour, 4-hour, and daily charts. The RSI also dropped into the oversold region below 30 before bouncing back, suggesting diminishing selling pressure and potential buyer intervention.
Such a divergence on the daily chart is a rare occurrence. Since 2020, Bitcoin has shown this setup only six times, each time preceding a significant price recovery. The last such event occurred between July and August 2024, leading to a notable uptrend.
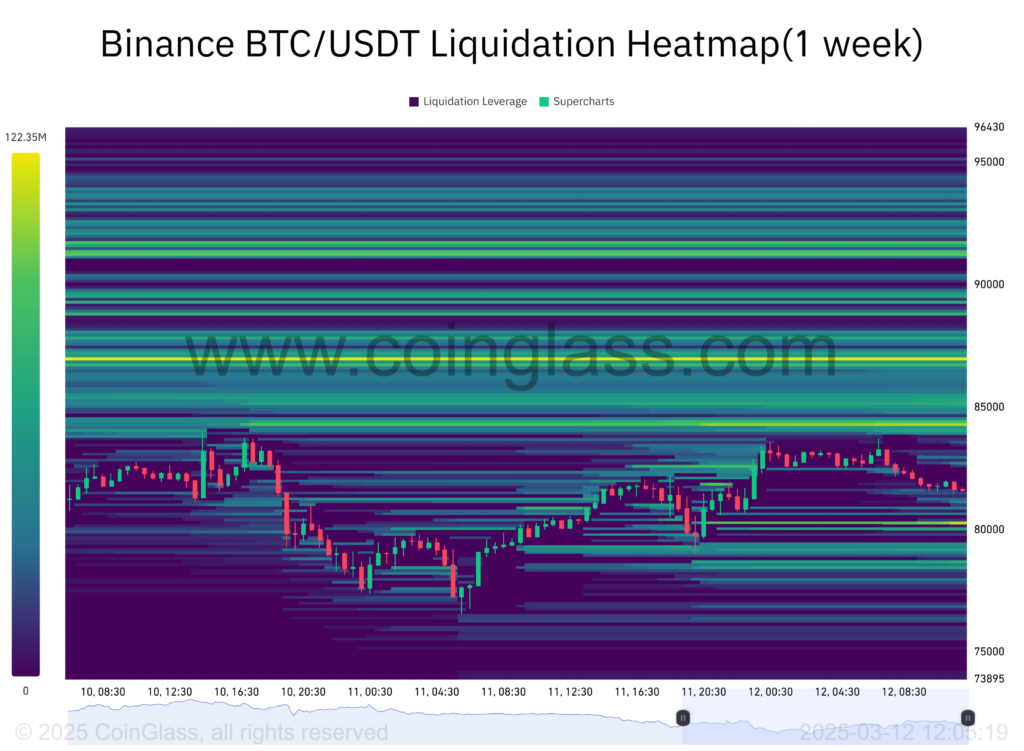
Additionally, Bitcoin’s dip below $78,150 cleared downside liquidity, allowing the price to recover above the $80,000 threshold. A liquidation heatmap suggests that BTC has now cleared its downside liquidity, leaving over $250 million in leveraged positions positioned for an upward move. This could propel Bitcoin toward the $85,000–$87,000 range in the coming days.
Inverse Head and Shoulders Pattern Targets $88,000
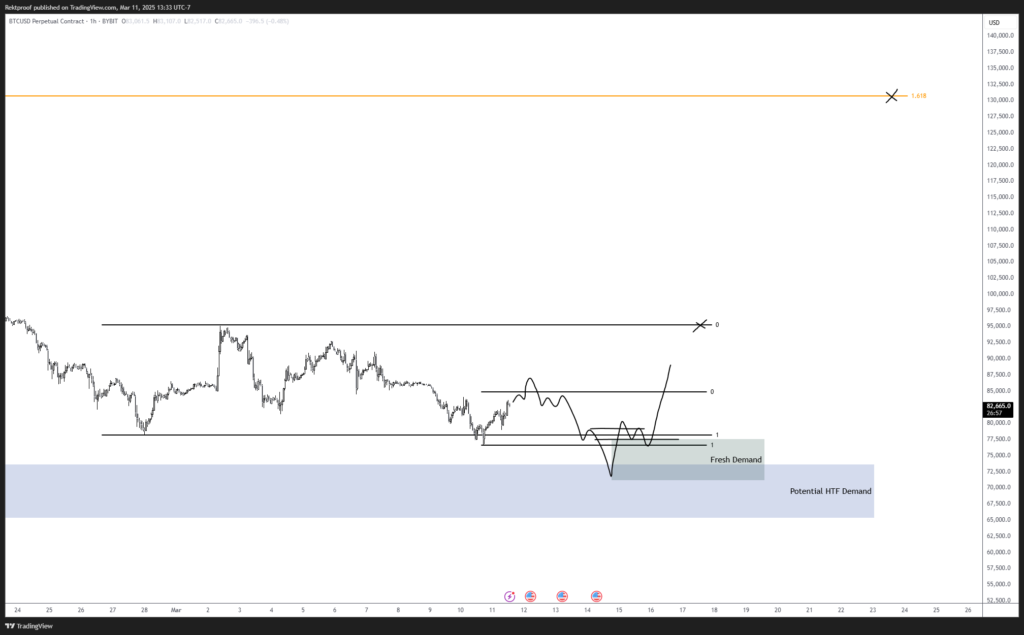
On the 1-hour chart, Bitcoin has formed an inverse head and shoulders pattern, a classic bullish technical formation. Confirmation of this pattern would require a decisive close above the neckline at $83,800.
If BTC successfully breaks above this level, the pattern indicates a potential 7% upswing, which could push Bitcoin to $89,000. This target aligns with key Fibonacci retracement levels between the 0.50 and 0.618 Fibs, referencing Bitcoin’s previous lower high of $96,450 and lower low of $76,560.
However, this bullish setup would be invalidated if Bitcoin drops below $78,500. Falling beneath this threshold would negate the higher-high formation seen in lower time frames and could lead to further downside pressure.
Analysts Predict Near-Term Volatility
Crypto analysts, including RektProof, anticipate price consolidation near resistance levels between $86,000 and $88,000. However, a strong demand zone remains in place between $74,000 and $70,000, suggesting the possibility of future pullbacks before any sustained rally.
As Bitcoin navigates these key price levels, traders will be watching for further technical confirmations to determine whether the latest rally has the momentum to push toward new highs or if a short-term correction is on the horizon.
Leave a Reply