
BTC price dips as US-China tariff tensions and stock market volatility fuel investor anxiety
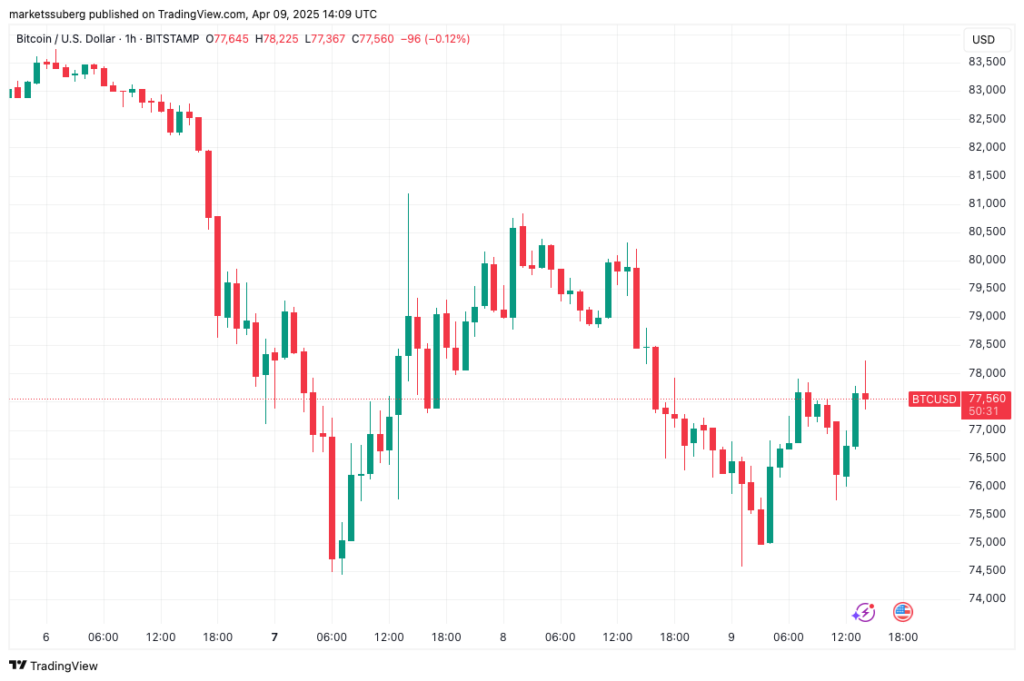
Bitcoin’s price took a hit on April 9, briefly falling below $75,000 before rebounding to around $78,300 as Wall Street opened. The cryptocurrency mirrored the extreme volatility in US stock markets, driven by escalating US-China trade tensions and investor uncertainty, raising fears of a further drop to the $71,000 level—its lowest in five months.
Stock Market Whiplash Reflects on Crypto
According to data from Markets Pro and TradingView, BTC/USD saw significant intraday fluctuations, echoing the erratic behaviour of the S&P 500. A dramatic intraday reversal in the index—its largest ever on a point basis—was triggered by the latest round of tit-for-tat tariff announcements from the United States and China. Trading platform The Kobeissi Letter described the movements as historic, surpassing volatility levels witnessed during crises in 2020, 2008, and 2001.
Analysts note that investor sentiment remains fragile. “The problem with markets right now is that both bulls and bears feel uncomfortable,” Kobeissi posted on X. “A single post from President Trump can swing $5 trillion in market cap—this leads to herd-like behaviour, with gains quickly turning into losses and vice-versa.”
Crypto Sentiment Weakens Amid Broader Uncertainty
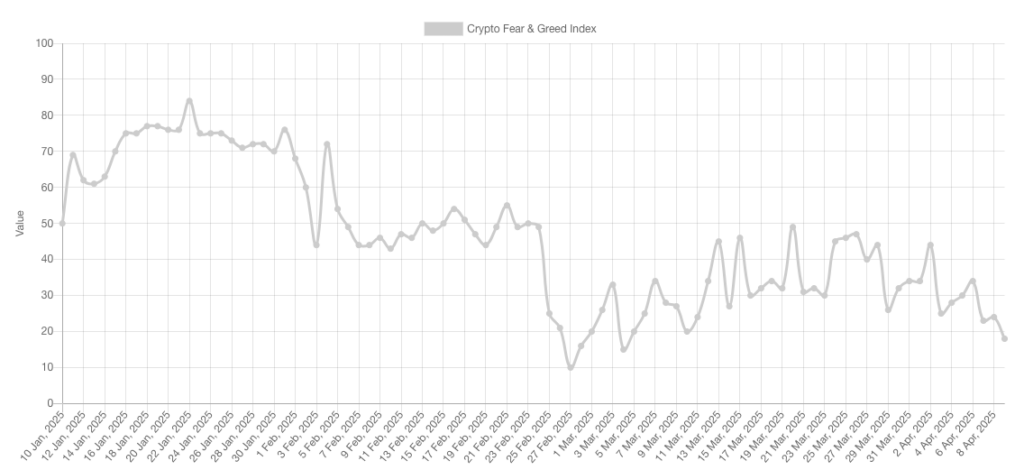
The broader cryptocurrency market wasn’t immune to the chaos. The Crypto Fear & Greed Index fell to its lowest level since early March, signalling growing fear among traders. Keith Alan, co-founder of Material Indicators, expressed reluctance to buy despite attractive prices. “Part of me wants to sit on my hands and wait for this storm to pass,” he posted on X, citing shaky order book conditions for Ether (ETH) and Solana (SOL).
While some investors are eyeing discounted prices as an opportunity, Alan remains cautious, warning that the situation may not improve in the short term. However, he acknowledged that accumulating bids on certain assets are making them more appealing to watch.
New Resistance Emerges from CME Futures Gap
A key resistance zone for Bitcoin has now formed between $82,000 and $85,000, due to a recently filled gap on the CME Bitcoin futures chart. According to popular crypto analyst Rekt Capital, BTC has broken down from its previous sideways range, confirming the gap as a new technical resistance level.
Rekt Capital also identified a new trading range between $71,000 and $83,000, with the lower boundary presenting a potential support level. “Bitcoin is experiencing downside continuation after wicking into the early March weekly lows,” the analyst explained. “BTC is now dropping into the $71,000–$83,000 volume gap to correct market inefficiencies.”
Long-Term Support Eyed at $70,000
Despite the short-term uncertainty, some traders believe a longer-term reversal could occur around the $70,000 mark. With Bitcoin now entrenched in a volatile trading zone and macroeconomic pressures unlikely to ease soon, all eyes remain on whether BTC can stabilise or if a deeper correction lies ahead.
Leave a Reply