
Ethereum (ETH) appears to be on a strong upward trajectory, with bullish technical indicators, rising transaction fees, and growing on-chain activity supporting its potential rally toward the $4,000 mark. A classic “bull flag” pattern and increasing total value locked (TVL) across its ecosystem are further strengthening investor confidence.
Bull Flag Formation Signals Further Gains
Ethereum is currently exhibiting a classic bull flag pattern on its daily chart, a formation that typically suggests the continuation of a strong upward trend. This pattern emerged after ETH experienced a sharp rise from $1,750 on 6 May to an eight-week high of $2,734 on 23 May — a gain of nearly 56%.
The breakout above the upper trendline of the bull flag, at $2,550, has validated the bullish setup. If the pattern plays out fully, Ether’s price could rise by the height of the prior uptrend, potentially reaching just under $4,000.
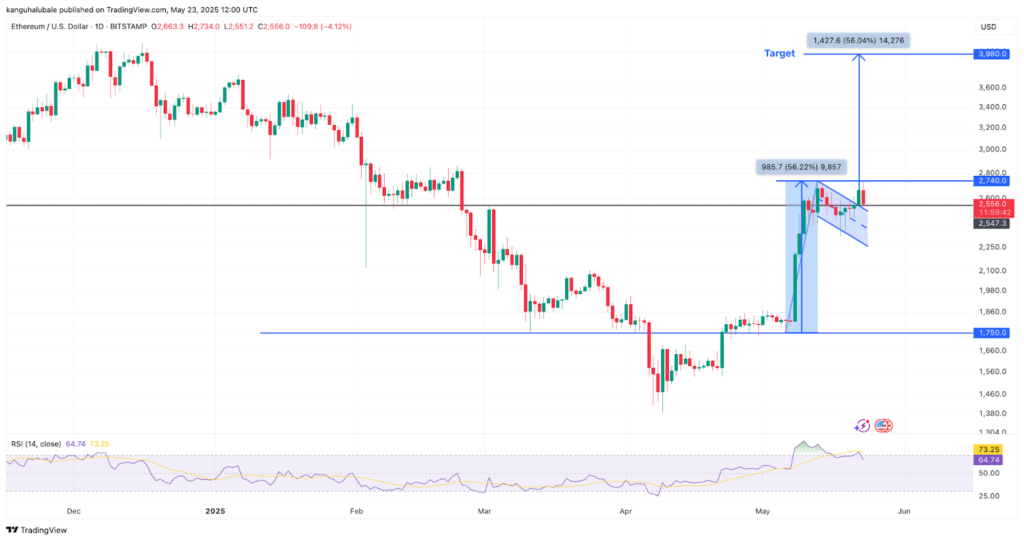
Leading crypto analyst Michael van de Poppe highlighted the importance of ETH holding its support at $2,400, noting that doing so would significantly increase the chances of a rally towards $3,500 and beyond.
Transaction Fees Hit Three-Month High
One of the key signs of increased network demand is rising transaction fees — and Ethereum is seeing just that. As of 22 May, the daily average transaction fee reached 0.0005 ETH (approximately $1.33), marking a 90-day high.
The surge in transaction costs is directly linked to higher network usage, with users engaging in decentralised finance (DeFi), non-fungible tokens (NFTs), and other decentralised applications (DApps). A 37% increase in daily transaction count over the last 30 days further supports the bullish sentiment.
Historically, periods of high transaction fees have coincided with major rallies. During the 2021 DeFi boom, fees skyrocketed to 0.015 ETH, indicating peak network congestion and user activity — conditions that often correlate with price surges.
Total Value Locked Surges 44% in a Month
Ethereum’s increasing TVL further underlines growing user activity and investor trust in the network. Over the past month, TVL on Ethereum-based smart contracts has risen from $45.26 billion on 22 April to $65.3 billion by 23 May — a jump of over 44%.
Protocols like Pendle have seen a 51% increase in deposits, while Ether.fi and EigenLayer also witnessed strong growth at 48%. Ethereum maintains its dominant position among layer-1 blockchains, commanding 54% of the total TVL. In contrast, Solana holds an 8% share, and BNB Chain stands at 5%.
Such growth in TVL often indicates higher usage and investment into the Ethereum ecosystem, strengthening the fundamentals that support a price rally.
ETF Inflows Add to Bullish Momentum
Further adding to Ethereum’s bullish outlook are the recent net inflows into US-listed spot Ether ETFs. Between 13 May and 22 May, these funds recorded a total of $249 million in net inflows.
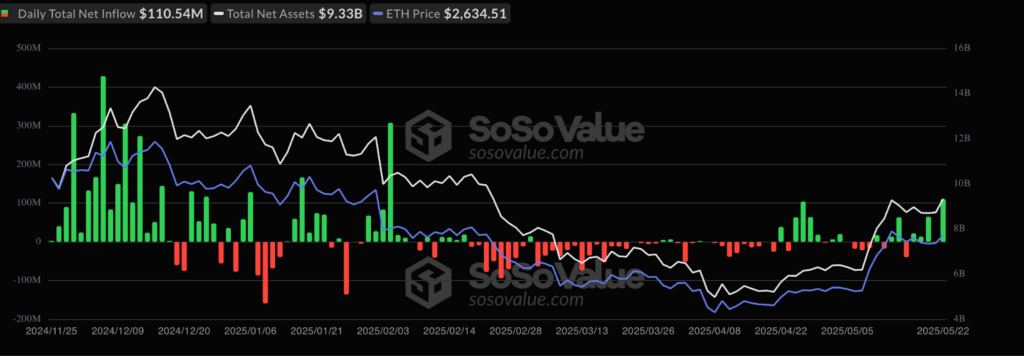
ETF inflows reflect growing institutional interest in Ether, contributing to demand-side pressure that could further elevate the token’s price. The combination of rising institutional investment, user activity, and technical strength paints an optimistic picture for the weeks ahead.
Outlook: A Climb to $4,000?
All signs point to a continuation of Ethereum’s bullish trend. The confirmed bull flag breakout, alongside increased on-chain activity and rising ETF inflows, suggests that ETH could potentially reach the $4,000 level if key supports — particularly the $2,400 mark — hold firm.
With the broader crypto market buoyed by Bitcoin’s new all-time highs and improved macroeconomic sentiment, Ethereum’s rally may just be getting started. Investors and analysts alike will be watching closely to see if ETH can replicate its past performances during high-activity periods and push past significant resistance levels in the coming weeks.
Leave a Reply