
XRP is once again flashing a technical warning that has historically preceded major price drops. The token’s daily Stochastic RSI has entered the overbought zone, a pattern that has, on average, led to 25% declines in 2025. This development raises red flags for traders and investors who may be hoping for further upside in July.
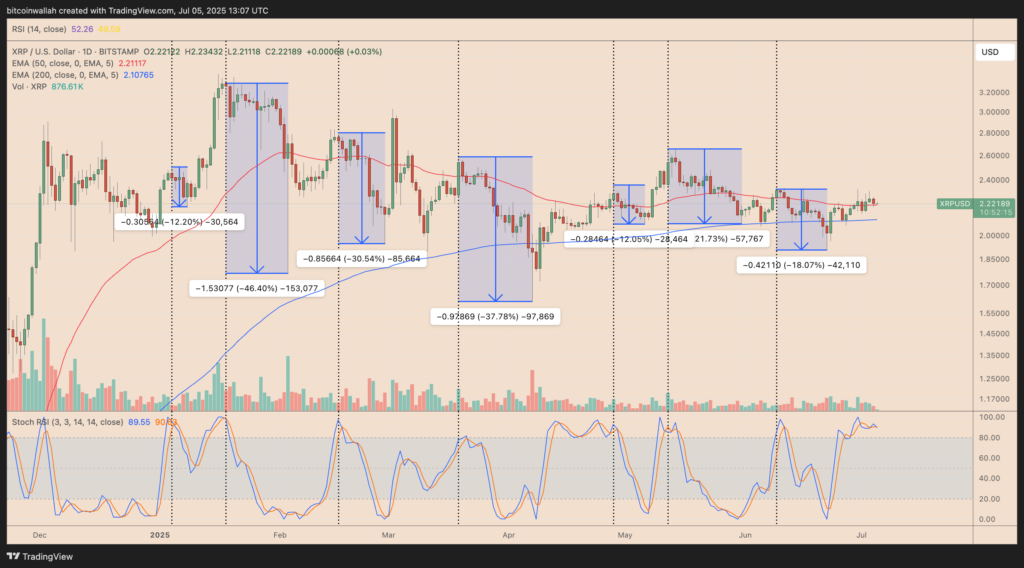
The Stochastic RSI, which compares an asset’s Relative Strength Index (RSI) to its recent high-low range, moved above the 80 threshold on June 28. This level is considered overbought and often signals a weakening upward momentum. In previous cases this year, XRP saw price corrections between 12% and 45% after such signals, with an average drawdown exceeding 25%.
Unless invalidated by a decisive bullish breakout, this pattern suggests a higher probability of downward pressure in the short to mid-term.
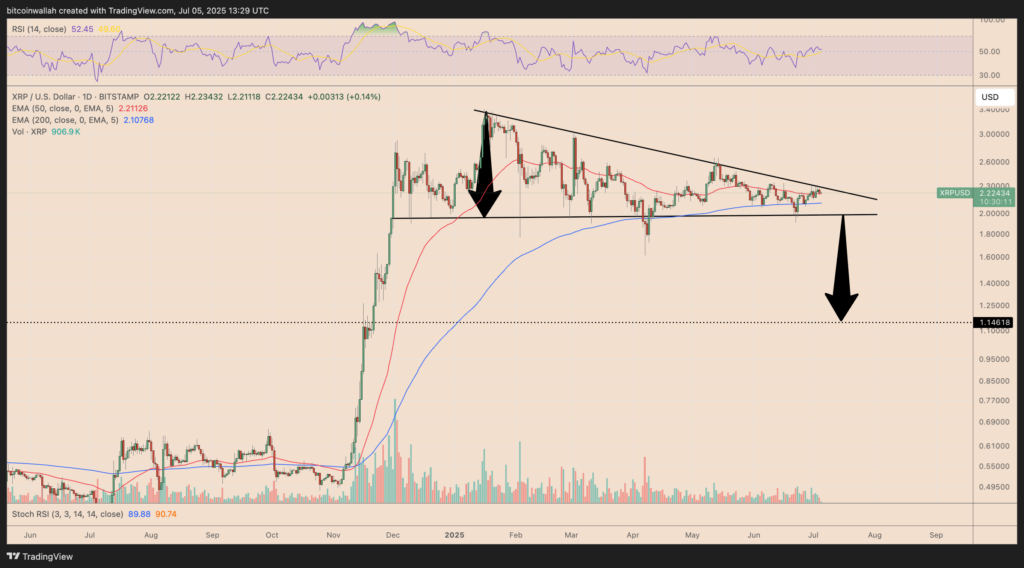
Chart Patterns Point to Deeper Downside
Beyond momentum indicators, XRP’s technical chart structures further support the bearish narrative. A descending triangle formation has emerged following its strong rally earlier in the year. Such patterns typically indicate a bearish continuation, with downside targets near $1.14, which represents a 50% decline from current levels.
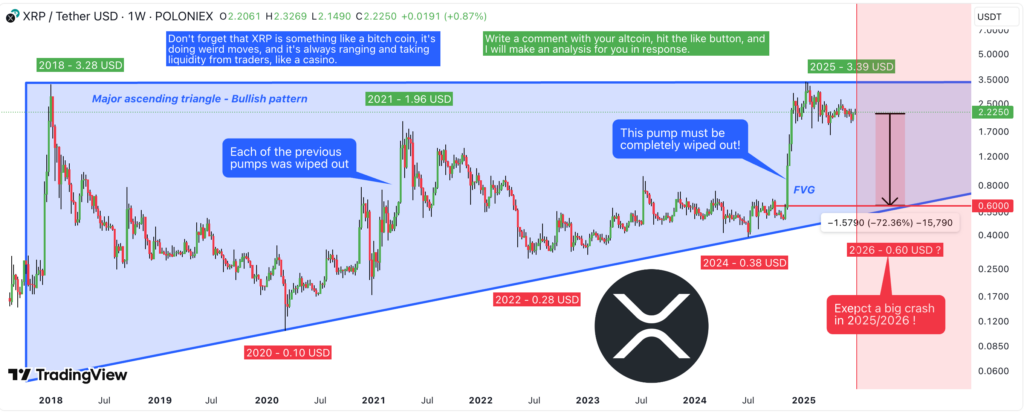
Analyst Xanrox offers an even bleaker outlook. Citing a multi-year ascending triangle dating back to 2017, he believes XRP may correct significantly due to unfilled Fair Value Gaps (FVG) created during Ripple’s sharp rally to $3.40 earlier this year. These gaps essentially price inefficiencies left behind after vertical moves are historically known to attract strong reversal moves.
According to his analysis, XRP may revisit the lower boundary of the triangle at around $0.60, a nearly 70% drawdown from current levels.
Not Everyone Is Bearish
Despite the alarming signals, bullish analysts still see upside potential for XRP. Mikybull Crypto points to a symmetrical triangle breakout pattern, which, if confirmed, could send XRP to $3.70 by September. This pattern differs from the descending triangle in that it does not inherently favour bulls or bears, the direction of the breakout is key.
Meanwhile, XForceGlobal offers a much more optimistic view, projecting a target range between $8 and $27 based on long-term Fibonacci extension levels. Other analysts have also cited whale accumulation and a falling wedge breakout, which typically indicates a bullish reversal, with price targets hovering around $3.20.
Critical Weeks Ahead for XRP
Ripple’s current market structure presents a mixed but cautious outlook. On one hand, the flashing Stochastic RSI signal, descending triangle pattern, and historical drawdown behaviour hint at a probable correction. On the other, bulls remain hopeful, betting on chart breakouts and large-scale accumulation to drive the price higher.
Whether XRP continues its upward momentum or faces another sharp pullback will largely depend on how it performs against key support and resistance levels in the coming weeks. For now, traders are advised to watch closely, as Ripple’s history of volatility could repeat itself.
Leave a Reply