
As Ethereum celebrates a decade of innovation, it’s not just candles and cake lighting up the network, its price action is stealing the spotlight. July 2025 marks a stunning comeback for ETH, with a 53% rally, its best monthly performance since the bull run of early 2021. Once written off earlier this year, Ethereum’s resurgence is now fuelling optimism that a new all-time high may be just around the corner.
Ethereum’s July Comeback: A Technical Masterclass
Ethereum’s July performance has been nothing short of impressive. Clocking a 55% monthly gain, ETH is set for its strongest close since November 2021, when it reached its previous all-time high. This price recovery also puts ETH on the verge of breaking a crucial resistance level at $3,850, the final major barrier before entering uncharted territory.
Adding weight to the optimism is a rare and powerful Morning Star candlestick formation on the monthly chart. This bullish three-candle pattern indicates a potential long-term reversal from bearish to bullish momentum. Historically, this setup has preceded major price rallies in Ethereum’s price history.
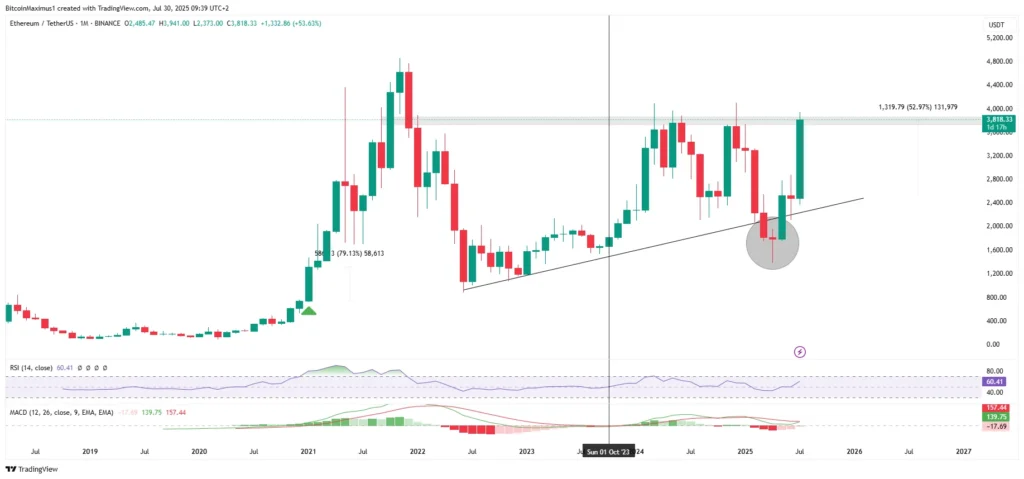
Momentum indicators also confirm the shift. The Relative Strength Index (RSI) has crossed above 50, signalling strength, while the MACD (Moving Average Convergence Divergence) has made a bullish crossover in positive territory. The last time both signals aligned like this, Ethereum enjoyed six consecutive months of upward momentum.
Wave Counts and Fibonacci Targets: Mapping the Next ATH
Beyond short-term momentum, Ethereum’s Elliott Wave structure paints a compelling long-term picture. Since the bear market low in June 2022, Ethereum has moved in a corrective wave pattern, with the recent surge forming part of wave C in an A-B-C correction structure.
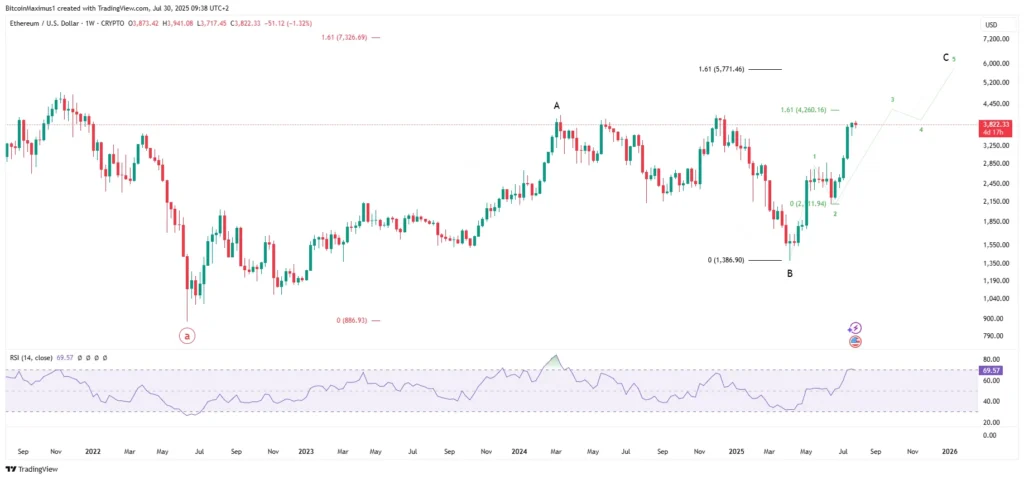
Currently, Ethereum appears to be in sub-wave 3 of wave C, typically the most explosive leg of the cycle. This wave is targeting approximately $4,260, with the full five-wave structure potentially peaking around $5,770.
Fibonacci projections push the ceiling even higher. The 1.61 external retracement of Ethereum’s previous decline suggests an upper limit around $7,326, a level consistent with both historical trend reversals and the MVRV band-based valuations.
ETH/BTC Ratio Signals Altseason
Ethereum’s bullish outlook isn’t just visible in its USD pairing. The ETH/BTC ratio, a widely watched indicator of altcoin strength versus Bitcoin, has flipped the script after a five-year downtrend. It broke out above a key descending resistance trendline in April, retested it as support, and then exploded higher in July.
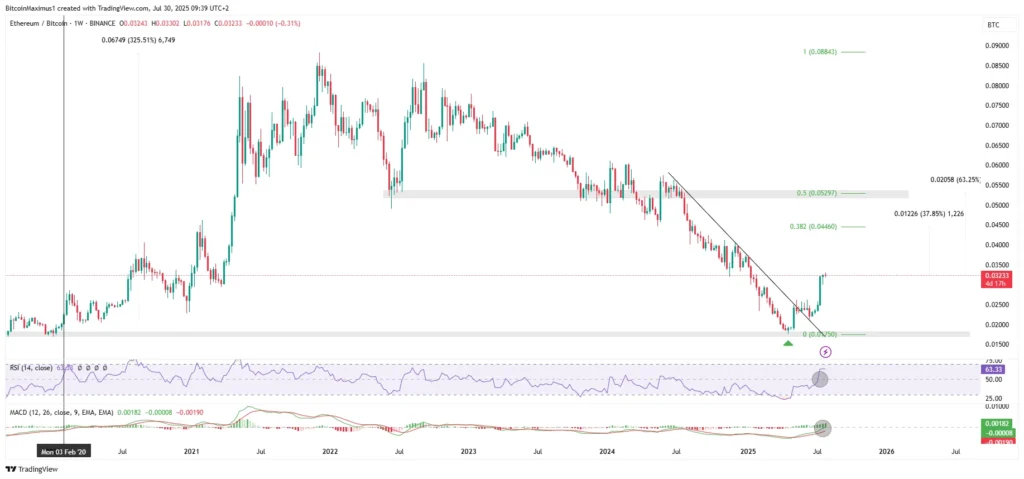
This reversal has sparked whispers of a new altseason, where alternative cryptocurrencies, led by Ethereum, outperform Bitcoin. Yet, ETH/BTC is still trading below its major resistance levels at ₿0.044 and ₿0.053 representing 37% and 63% potential upside, respectively.
Much like its USD chart, the ETH/BTC pairing has also flashed a combined RSI and MACD signal that previously led to a 300% rally. If history repeats, Ethereum could significantly outperform Bitcoin over the next 12–18 months.
On-Chain Data and ETF Inflows: Institutional Confidence Grows
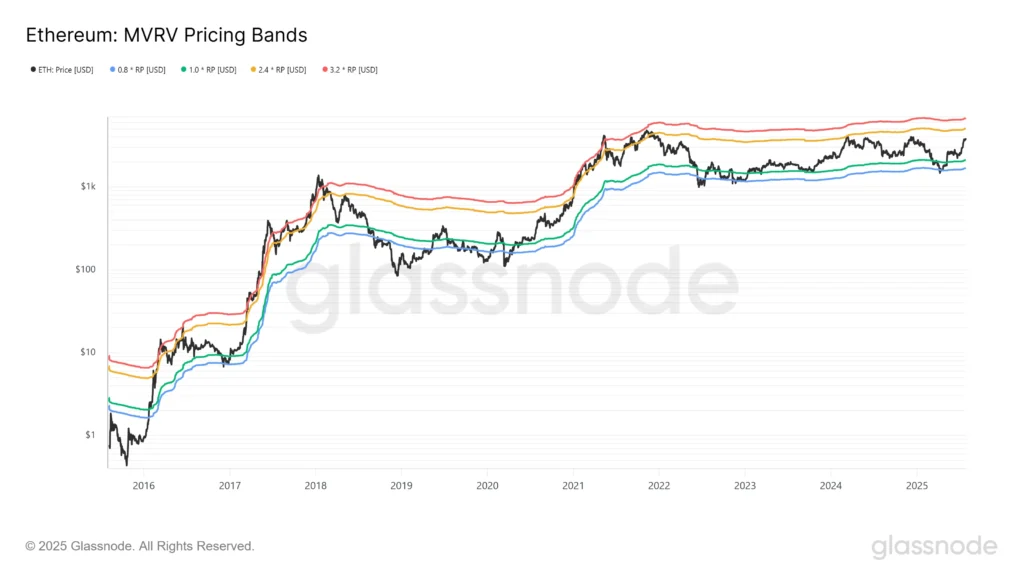
Ethereum’s bullish trajectory isn’t just driven by speculative interest. On-chain indicators suggest the rally has strong fundamentals backing it. One such metric, the MVRV Pricing Band, which assesses the ratio between market value and realised value, points to a potential market top in the $5,000–$6,500 range, mirroring technical targets.
Meanwhile, institutional interest in Ethereum is booming. Ethereum ETFs saw record-breaking inflows in July 2025, even surpassing Bitcoin on multiple days. Over $11.2 billion flowed into crypto ETFs this month, the largest single-month total ever, eclipsing the previous high of $7.6 billion in December 2024.
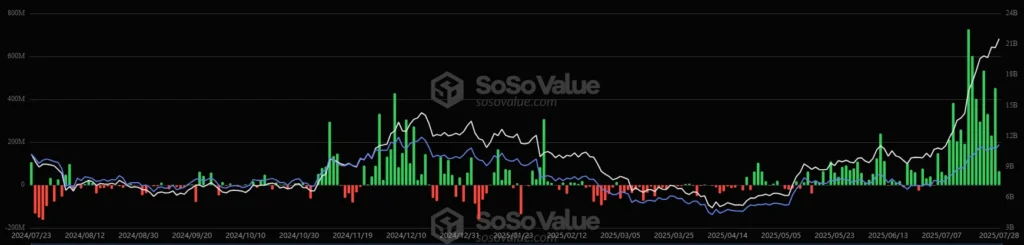
Ethereum itself attracted over $21 billion in total ETF inflows. What’s striking is that these flows are occurring before Ethereum has broken its all-time high, indicating that investors are positioning early for the next leg up.
From Smart Contracts to Smart Money
As Ethereum turns 10, the protocol stands as a symbol of what decentralised finance can achieve. From the first smart contract to the rise of DeFi, NFTs, and Layer-2 scaling solutions, Ethereum has continually evolved. Now, its transition to proof-of-stake and the rollout of scalable infrastructure is drawing serious institutional capital into the ecosystem.
With powerful technical formations, strong on-chain metrics, rising ETF interest, and a shift in the ETH/BTC ratio, Ethereum looks well-positioned to lead the next phase of crypto growth.
If the current momentum sustains, Ethereum could soon retest and possibly break its previous all-time high near $4,900, with $5,770 to $7,326 as the new price targets for 2025.
The next few months could very well define the next era for Ethereum. And as it enters its second decade, one thing is clear: Ethereum isn’t just back, it’s just getting started.
Leave a Reply