
The crypto market is surging, with investors increasingly optimistic about reaching a fresh all-time high (ATH). A key driver of this momentum is a major policy shift in the United States, as President Donald Trump has signed an executive order allowing cryptocurrencies to be included in 401(k) retirement plans.
Bitcoin’s dominance is slipping, giving altcoins the perfect stage to shine. Technical charts and market indicators are flashing bullish signals, suggesting the rally could extend well into the coming months.
Crypto Market Breaks Higher
The total cryptocurrency market capitalisation (TOTALCAP) staged a sharp rally yesterday, with gains continuing into today. This rebound came exactly at the $3.65 trillion horizontal support level, the same point as the previous all-time high.
In market terms, such a retest often acts as a springboard, giving prices the push they need to climb higher. If current momentum holds through the week, TOTALCAP could print a bullish engulfing candlestick on the weekly chart, a classic signal that a trend reversal is firmly in place.
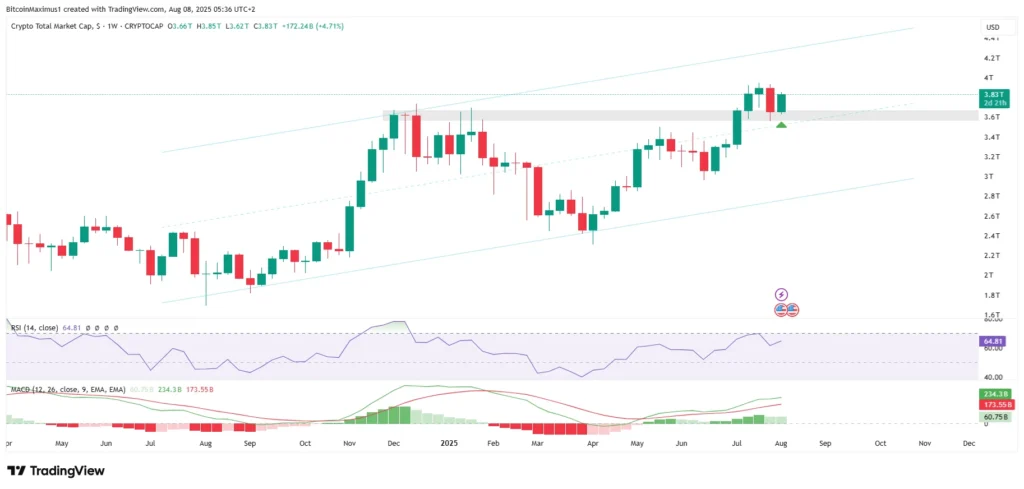
The next key upside target stands at around $4.5 trillion. This aligns with the resistance trendline of a long-term ascending parallel channel, making it a significant level for traders to watch.
Technical Indicators Support the Bulls
Momentum indicators are firmly in bullish territory. The Relative Strength Index (RSI) remains above 50, indicating continued upward momentum. The Moving Average Convergence/Divergence (MACD) has also crossed into positive territory, another clear sign that the bulls are in control.
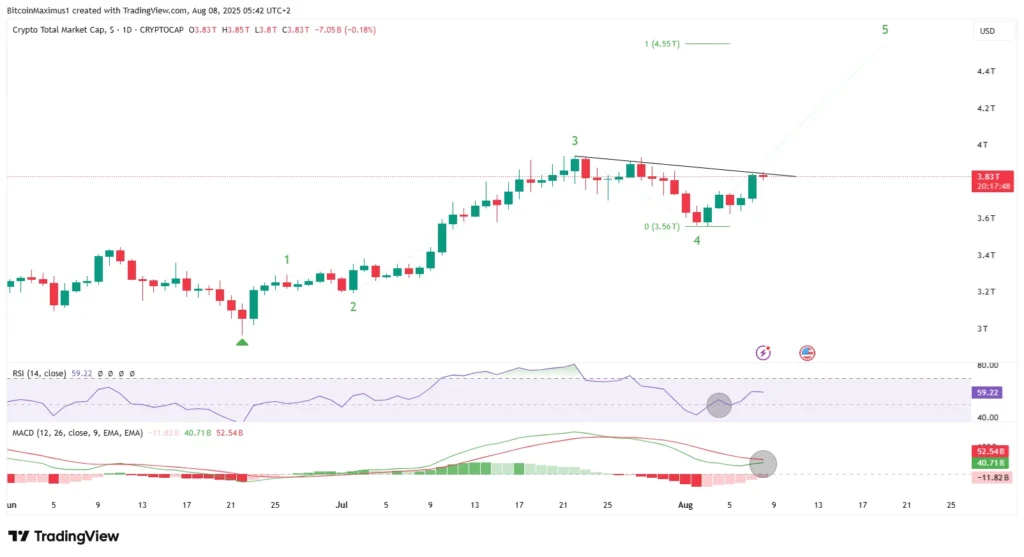
Short-term price action confirms this outlook. TOTALCAP appears to have entered the fifth and final wave of the rally that began on 22 June. If the market can break through current resistance, this fifth-wave extension could push prices towards $4.55 trillion, matching the long-term technical target.
Bitcoin Dominance Drops, Altcoins Take Over
Bitcoin’s market dominance (BTC.D) has been on a downward trend since 25 June, when it peaked at 66.03%. After a brief recovery between 22 July and 2 August, dominance has resumed its decline, moving closer to the 21 July low.
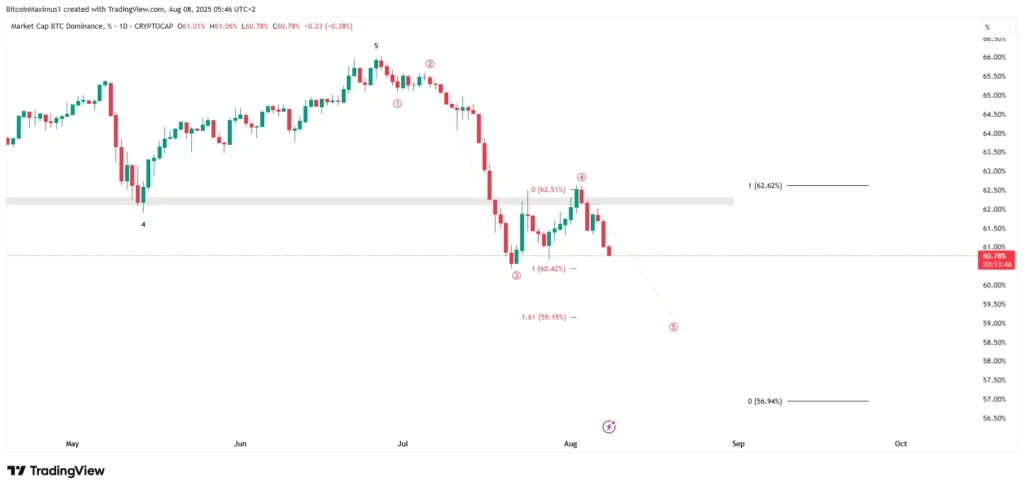
Wave analysis suggests that BTC.D is now in the fifth and final stage of its current decline. The first major target sits at 59.15%, based on the 1.61 external Fibonacci retracement support level. If a deeper fifth-wave extension plays out, dominance could drop as low as 57%.
Such a decline would extend the ongoing altcoin season, as capital shifts away from Bitcoin and into alternative cryptocurrencies. Analysts expect a significant bounce in BTC.D after one of these targets is reached, but until then, altcoins are likely to remain in the spotlight.
A New All-Time High in Sight
All signs point towards further gains in the crypto market. With strong technical support, bullish momentum indicators, and investor sentiment boosted by regulatory developments, the environment is primed for another leg higher.
Altcoin season is well underway and will likely continue as long as Bitcoin dominance weakens. A new market-wide all-time high appears imminent, with a correction unlikely until TOTALCAP approaches the $4.5 trillion level.
For traders and investors, the coming weeks could be critical. The mix of strong technicals, policy tailwinds, and shifting capital flows suggests that 2025 may yet deliver one of the strongest rallies the cryptocurrency market has seen in years.
Leave a Reply