
Pyth Network’s token, PYTH, surged over 100% in the past 24 hours, fuelled by strong accumulation and a significant move from the US Commerce Department to release GDP data on major blockchains. With the token trading around $0.223, well below its all-time high of $1.20, technical and on-chain indicators suggest there may still be more room for growth. However, volatility risks remain in play.
US Data Move Sparks Buying Interest
The sudden jump in PYTH came after the US Commerce Department confirmed it would distribute GDP data on chains such as Bitcoin, Ethereum, and Solana. Pyth Network plays a critical role by verifying this data on-chain, positioning itself at the centre of blockchain-based financial reporting.
While some traders treated the announcement as short-term hype, many buyers saw it as a step toward long-term adoption. This tug-of-war in sentiment explains the mixed reactions across different investor groups.
Whales Sell, But Buyers Step Up
On-chain data shows a split between regular whales and larger cohorts of investors. Standard whale wallets trimmed about 2.86% of their holdings in the past day, locking in profits after the sharp move. However, this selling pressure was more than matched by other buyers.
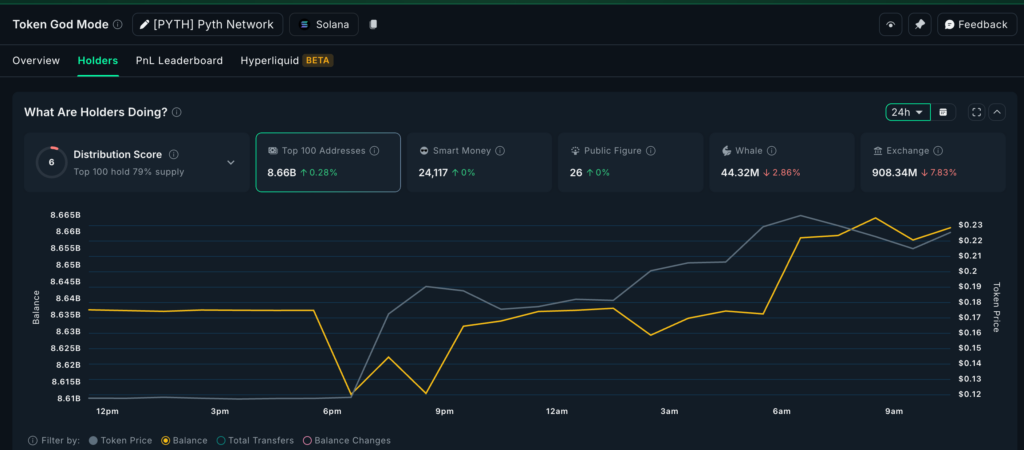
- Exchange reserves dropped by 77.2 million PYTH, worth about $17.2 million, signalling accumulation off exchanges and reduced selling risk.
- The top 100 addresses added 24.1 million PYTH, equal to about $5.37 million.
Taken together, buyers absorbed more than $22 million worth of tokens. The numbers show that while some whales are cautious, stronger hands are stepping in to accumulate.
Technical Patterns Point To Volatility And Potential Breakout
On the daily chart, PYTH shows a megaphone pattern, a formation where highs and lows are widening apart. This reflects increased volatility and suggests sharp swings could continue before a breakout occurs.
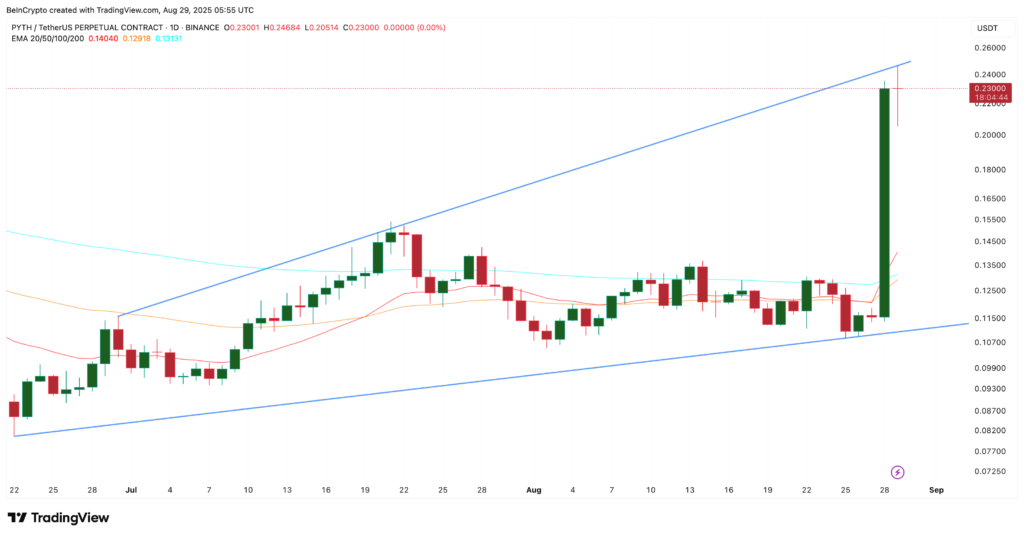
At the same time, moving averages are flashing bullish signs. The 50-day Exponential Moving Average (EMA) is close to crossing above the 100-day EMA. Traders often view this as a “golden crossover” a sign that buyer strength is outweighing seller pressure.
If this crossover confirms within the megaphone setup, PYTH could break out strongly, with the upper trendline offering the next key resistance to watch.
Key Levels As Bulls Hold Momentum
Short-term charts add weight to the bullish case. On the 4-hour timeframe, the Bull Bear Power (BBP) indicator remains in positive territory, showing buyers still dominate momentum.
For now, traders are watching the following levels:
- Support zones: $0.1935 and $0.1730, a drop below these could weaken the bullish outlook.
- Resistance levels: $0.2622, with potential to target $0.40 if momentum holds.
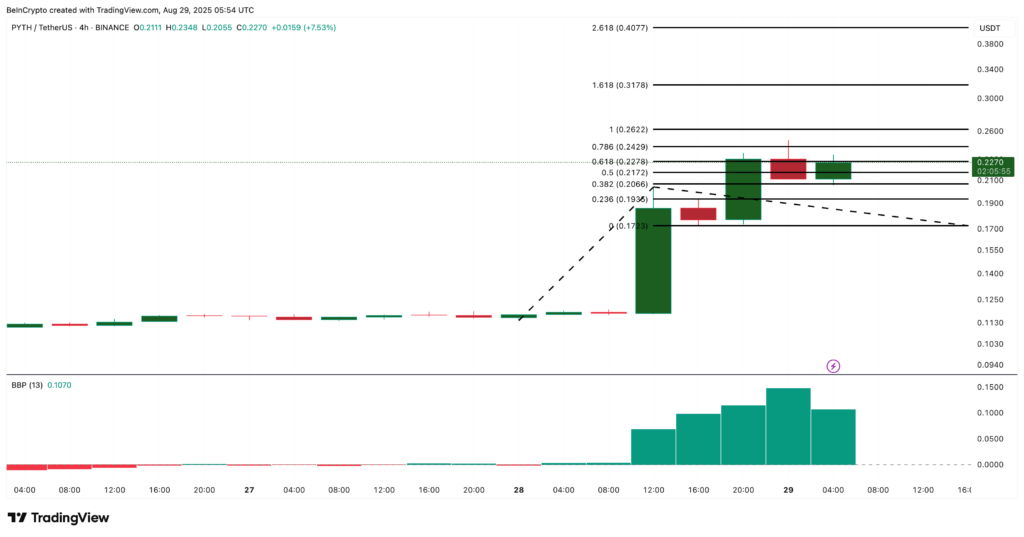
From the current $0.223, breaking resistance could mean a near 80% upside, though traders should remain alert to pullbacks given the volatile structure.
Pyth Network is benefitting from both fundamental adoption signals and strong on-chain accumulation. While some whales are cashing out, broader buying activity and technical triggers suggest PYTH still has room to rally.
As long as key supports remain intact and the golden crossover forms, bulls may retain the upper hand. Clearing the $0.2622 barrier could pave the way toward $0.40, keeping the possibility of an 80% rally alive, but not without volatility along the way.
Leave a Reply