
The price of XPIN, the native token of XPIN Network, surged by 100% within 24 hours, hitting a new all-time high (ATH) of $0.0029 before slightly retracing to $0.0025. This sharp rise marks a major milestone for the BNB Chain-based DePIN (Decentralised Physical Infrastructure Network) project, which leverages AI-powered decentralised connectivity.
Prior to the surge, XPIN had traded quietly around $0.0013 as of October 16, before breaking out of a key consolidation pattern. The sudden rally has prompted questions about whether XPIN’s move is backed by strong fundamentals or short-term speculation.
Symmetrical Triangle Break Confirms Bullish Trend
According to on-chain and technical data, XPIN’s breakout followed a confirmed symmetrical triangle pattern, a setup that typically precedes significant directional moves. Once XPIN broke above the upper trendline, momentum accelerated rapidly, leading to its doubling in price.
Supporting this move was the Bull Bear Power (BBP) indicator, which flashed consecutive green histogram bars, a signal that buyers were firmly in control. Additionally, the Supertrend indicator turned bullish, with its green support line now positioned beneath the price, suggesting that the breakout has technical backing.
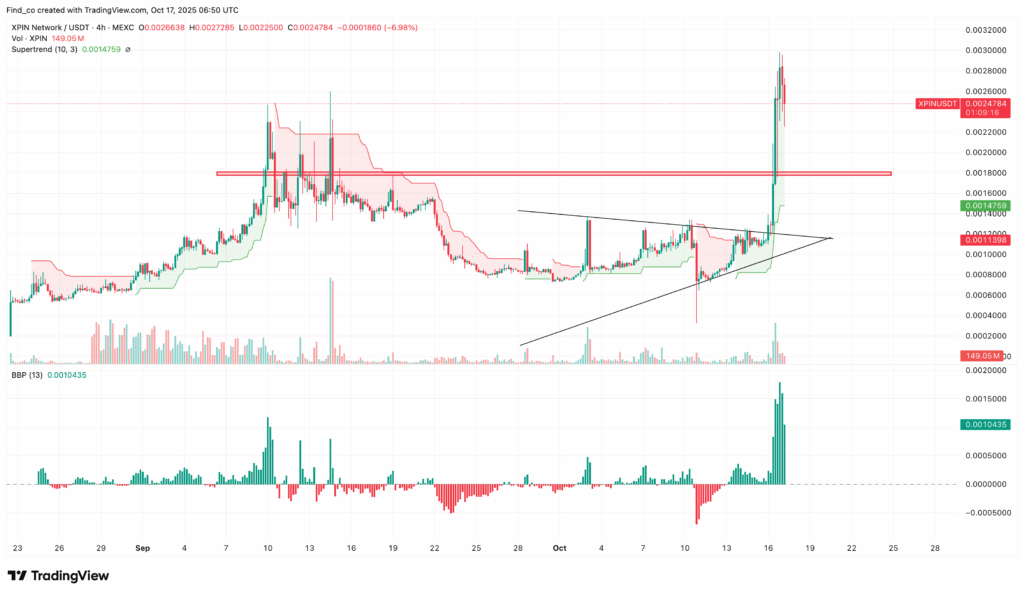
However, XPIN has encountered notable resistance around $0.0029, its new ATH. Analysts note that unless buying strength increases, the token may find it difficult to push higher in the short term.
Trading Volume Jumps 9x: Real Demand or Speculative Fervour?
Perhaps the most striking factor behind XPIN’s rally is its explosive surge in trading volume. Data from Santiment shows that XPIN’s daily trading volume jumped from $20 million to over $179 million, a nearly ninefold increase in less than 24 hours.
A surge in both price and volume generally signals genuine buying interest, rather than purely speculative trades. If this heightened activity continues, it could help XPIN stabilise at its current levels or even attempt another leg upward.
However, the same volume spike could also indicate volatility rather than stability. If large traders start taking profits, XPIN could experience a temporary correction before potentially resuming its uptrend.
Some analysts have already voiced caution. A popular pseudonymous trader on X (formerly Twitter) warned that XPIN’s recent structure resembles a double top pattern, a bearish formation that often precedes corrections. “Looks like a double top and bull trap here. Bulls need to break above ATH levels, otherwise the pullback could be EPIC,” the analyst commented.
Technical Indicators Signal Overbought Conditions
On the daily chart, XPIN’s bullish momentum appears to be cooling. The Bollinger Bands (BB) have widened considerably, indicating increased volatility, while the token’s price has touched the upper band, a classic sign that the asset might be entering overbought territory.
The Relative Strength Index (RSI) reinforces this outlook. After breaching the overbought threshold, it has started to slope downward, suggesting that buying pressure is easing. If this continues, XPIN may face difficulty holding above $0.0024, its immediate support zone.
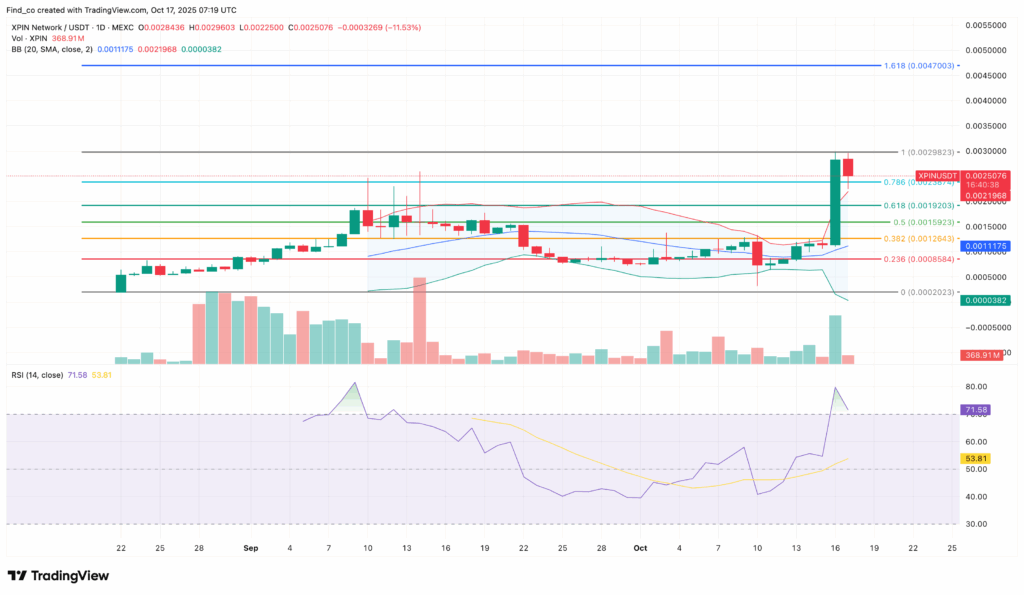
A confirmed breakdown below that level could open the door to deeper retracements, with the next strong support expected near $0.0019.
What Lies Ahead for XPIN?
Despite short-term technical headwinds, XPIN’s broader trend remains bullish as long as it maintains support above $0.0024. Sustained demand and renewed market enthusiasm could help the token reclaim its recent peak and target higher resistance levels, potentially around $0.0047 in the next leg up.
That said, traders should remain cautious. The mix of high volatility, expanding Bollinger Bands and an overbought RSI hints that a healthy correction may be imminent before any further upside.
XPIN Network’s remarkable 100% surge underscores growing investor interest in AI-driven DePIN projects on BNB Chain, but with technical indicators flashing mixed signals, the coming days will determine whether this rally marks the start of a new bull phase or the prelude to a short-term pullback.
Leave a Reply