Solana’s latest recovery attempt has lost momentum, with the SOL price struggling to stay above $145 amid weakening network activity, falling TVL, and the first negative flows into its spot ETF. A bearish technical structure now points to a potential slide toward the $100 region.
Network Activity Declines as ETF Flows Turn Negative
Solana’s spot ETFs recorded their first daily net outflow since launch, with $8.2 million exiting on Wednesday. This shift signals cooling institutional appetite at a time when Solana’s on-chain activity has weakened.
Nansen data shows a 6 percent drop in active addresses along with a 16 percent decline in fees collected over the past week.
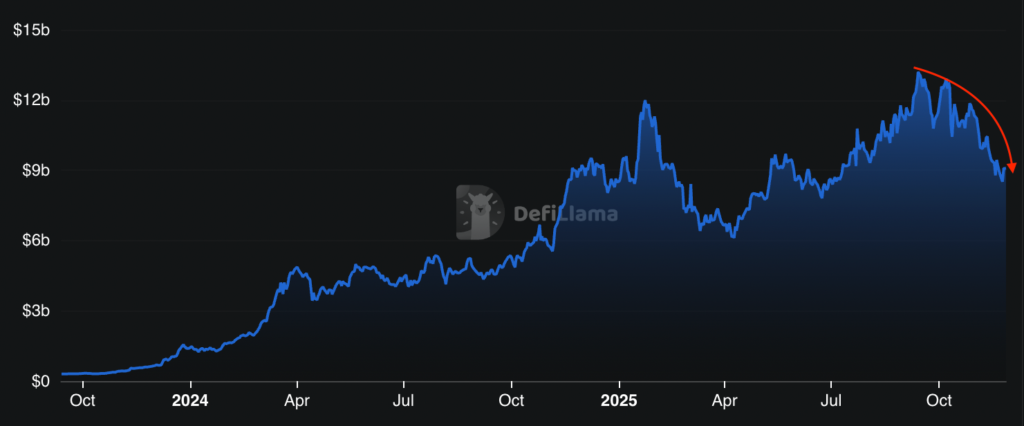
Total value locked on Solana has also taken a hit, falling 20 percent in November and sliding from a September peak of $13.23 billion to $9.1 billion by 11 November.
Some of Solana’s key protocols saw steep monthly declines in deposits. Jito fell 33 percent, Jupiter dropped 28 percent, Raydium dipped 31 percent, and Sanctum decreased 22 percent.
These signs of falling demand do not confirm that SOL will remain under $150, however they indicate that recovery attempts may face resistance.
Derivatives Market and Fee Stagnation Slow Rebound
Aside from a weaker DeFi landscape, Solana’s stagnant network fees and a soft derivatives market have contributed to a fragile recovery. Futures activity has not shown strong bullish conviction, limiting the token’s ability to reclaim higher resistance levels.
Traders say the momentum required to push through the $145 to $150 zone has not yet emerged.
Upbit Hack Adds Fresh Volatility to SOL Market
Confidence was further shaken after South Korean exchange Upbit reported a $36 million theft from its Solana hot wallet.
Although the exchange described the incident as a breach rather than a flaw within the Solana network, it suspended SOL deposits and withdrawals while initiating maintenance.
This temporary freeze reduces liquidity and may amplify short term sell pressure, as participants cannot move funds in or out easily.
SOL briefly rose three percent to $143 following the announcement, showing initial resilience. Even so, analysts expect the hack related disruption to weigh on market sentiment.
Bear Flag Pattern Points to Target Near $100
SOL’s six hour chart shows a classic bear flag pattern. The structure began forming after the token touched $170 on 17 November and then drifted higher within a narrow channel.
The lower boundary of the flag sits around $140. A decisive move beneath this level would confirm the continuation pattern and set up a measured target near $99, implying losses of around 30 percent from recent levels.
Trader MR Ape noted that the $145 region has already rejected the price on three occasions and that momentum appears to be stalling as SOL approaches this zone.
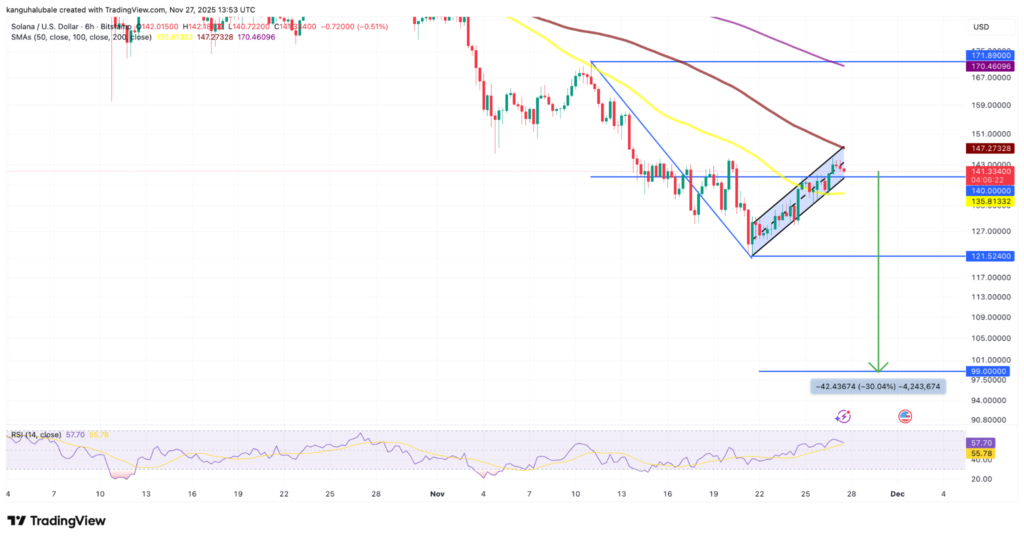
A drop below $120 would strengthen the bearish case, raising the risk of declines toward $110 and later $95, where buyers may attempt to halt the downtrend.
Outlook
Solana has shown remarkable strength throughout the year, however near term indicators suggest that the token may struggle to break above $150 without clear improvement in on-chain demand and institutional flows.
Until network activity stabilises and the derivatives market turns supportive, SOL could remain vulnerable to deeper corrections.
Leave a Reply