
Bitcoin’s Hash Ribbons indicator has issued another “buy” signal even as the price struggles near the $90,000 mark, offering traders a potential sign of long-term upside despite ongoing market uncertainty.
Hash Ribbons Issues Fifth Buy Signal of 2025
The Hash Ribbons metric, monitored by Capriole Investments, flashed its fifth buy signal of the year with Bitcoin trading around $91,204. The indicator identifies periods of miner capitulation followed by recovery. This latest signal arrived after the 30-day moving average of Bitcoin’s hashrate slipped below the 60-day moving average.
Historically, such crossovers have aligned with discounted price zones and long-term accumulation opportunities. Analysts often view these moments as markers of miner stress rather than immediate bullish catalysts.
Miners Under Pressure as Sales Increase
CryptoQuant analyst Darkfost explained that this signal highlights phases when miners operate under financial pressure. In these short periods, miners tend to sell more Bitcoin to keep operations running, which can push prices downward.
Despite miner reserves staying mostly stable throughout 2025, a clear uptick in selling has taken place since early October. Known miner wallets currently hold approximately 1.8 million BTC, a reduction of about 5,000 BTC since 10 October.
Bitcoin Trades Between Resistance and Demand Zone
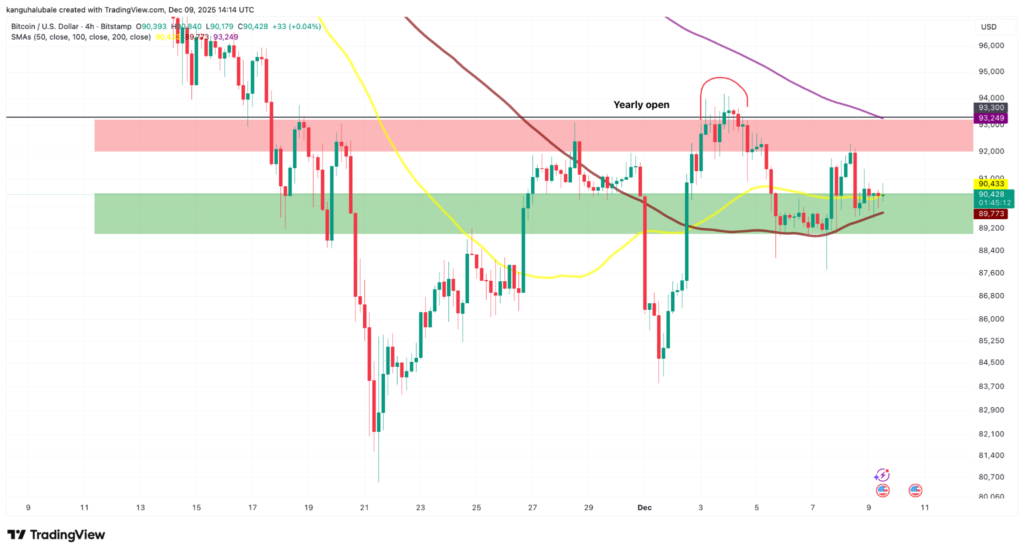
Bitcoin recently attempted a recovery that was halted near the yearly open level of $93,300. This point aligns with the 200-period simple moving average on the four-hour chart, reinforcing it as a major resistance zone.
On the downside, Bitcoin found support within the $89,000 to $90,500 demand region where the 50 and 100 simple moving averages meet. The price now sits in a narrow band that reflects traders’ hesitation about the next clear direction.
What BTC Needs for a Breakout
For Bitcoin to reverse its short-term downtrend, it must climb above $92,000 then move past the 200-period simple moving average. A successful breakout could open a path toward the $100,000 level.
Bears remain active near the $90,000 support. Analysts caution that a decisive drop below this zone may trigger an extended decline with potential downside reaching toward $40,000 if momentum weakens further.
Long-Term Outlook Remains Constructive
While current pressure on miners has created short-term uncertainty, the Hash Ribbons’ strong historical performance suggests that these periods often precede major market recoveries. Previous buy signals have consistently appeared near long-term bottoms, providing confidence for patient investors.
Market observers emphasise that the signal is not an instruction to rush into immediate buying. Instead, it offers insight into a market phase shaped by miner capitulation, rising selling activity, and a price range that continues to attract long-term accumulation.
Leave a Reply