
Bitcoin hovered close to the crucial $90,000 level on Friday as renewed selling pressure pushed traders to prepare for a deeper correction. The move followed a sharp rejection at the 2025 yearly open, leaving the market searching for firm support.
Traders Shift Focus to Levels Below $90,000
Bitcoin slipped nearly two percent from Thursday’s close, according to TradingView data. The rejection at the yearly open removed momentum for further gains. Many traders now expect a retest of lower support zones.
Market analyst Exitpump highlighted weakness on the bid side. The order book heatmap showed limited buy interest until the $86,000 region with major buy walls positioned only below that zone. Exitpump suggested that slowly filling the liquidity gap and resetting open interest would ultimately support future upside.
Crypto investor Ted Pillows pointed out two major liquidity clusters. Data from CoinGlass showed that upside liquidity sits around $94,500 while downside liquidity sits at $90,000. He believes a sweep of the lower band before any upward reversal is the more likely scenario. Pillows described the market structure as one of those moments where the price “cleans the lows then decides the next direction.”
Key Technical Levels Traders Are Watching
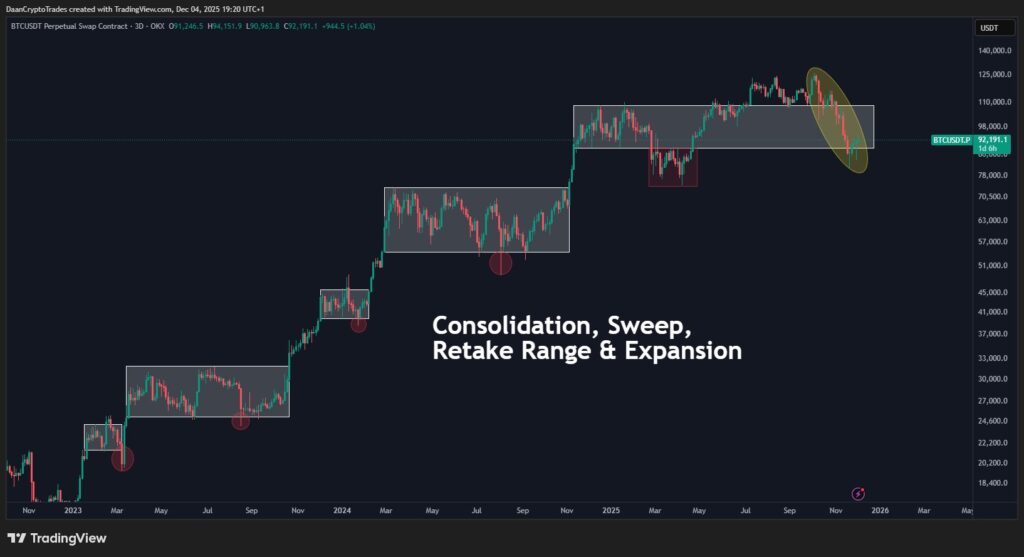
Trader Daan Crypto Trades stressed the importance of holding the $88,000 region on higher time frames. Losing that level could open the door to a deeper slide.
Sentiment across trading circles has shifted toward caution with analysts waiting for confirmation of support strength before predicting the next major move.
Ichimoku Cloud Signals Hint at a Larger Dip
Further bearish signals emerged from Ichimoku Cloud analysis. Trader Titan of Crypto revisited his earlier view that Bitcoin could revisit levels near the low $80,000 range.
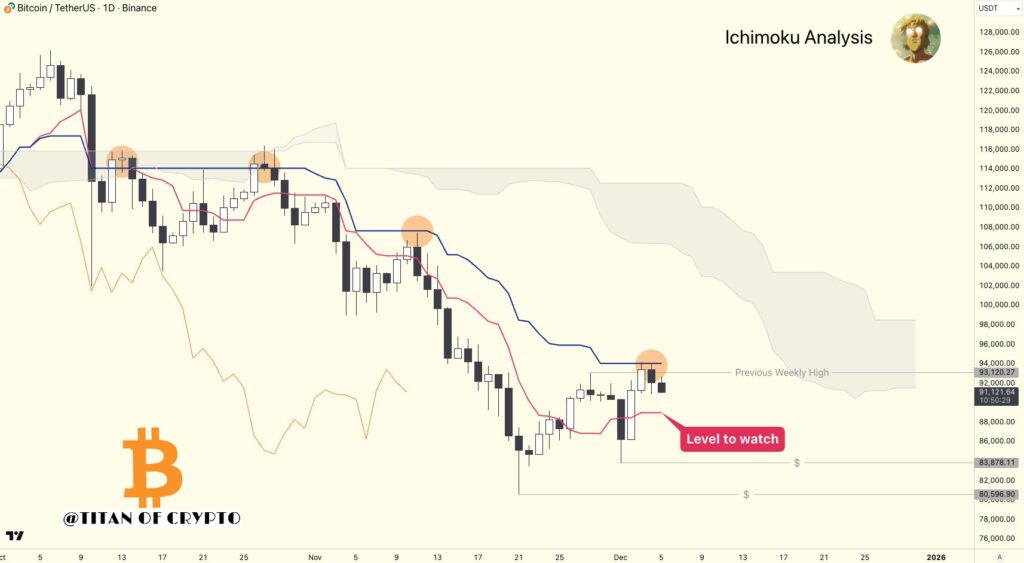
He pointed to a support area just under the recent $83,900 lows recorded earlier in the week. According to his analysis, Bitcoin failed to break above the Kijun after taking the previous weekly high. A pullback toward the Tenkan seems reasonable. Titan warned that if the Tenkan gives way, the next reliable support sits around $83,900.
Market Awaits Direction as Volatility Builds
With liquidity thinning on the buy side and technical indicators leaning bearish, traders remain cautious. Many expect a sweep of lower levels to flush out leverage before the market attempts any meaningful recovery.
For now, Bitcoin’s immediate challenge is to hold the $90,000 zone. A failure to do so could confirm the bearish outlook and bring the low $80,000 region back into focus.
Leave a Reply