
Bitcoin is showing renewed strength after weeks of sideways movement, with prices climbing to fresh two month highs near $98,000. A mix of technical indicators now suggests that the market may be transitioning out of its recent weakness, with traders closely watching the $101,000 level as a key zone for trend confirmation.
Momentum Indicators Signal Bullish Continuation
Bitcoin’s recent price action is being supported by leading momentum indicators that are turning decisively bullish. Data from TradingView shows the relative strength index is no longer stuck in neutral territory and is now favoring further upside. On shorter timeframes, RSI is forming a hidden bullish divergence, where price has printed a higher low while the indicator briefly dipped lower.
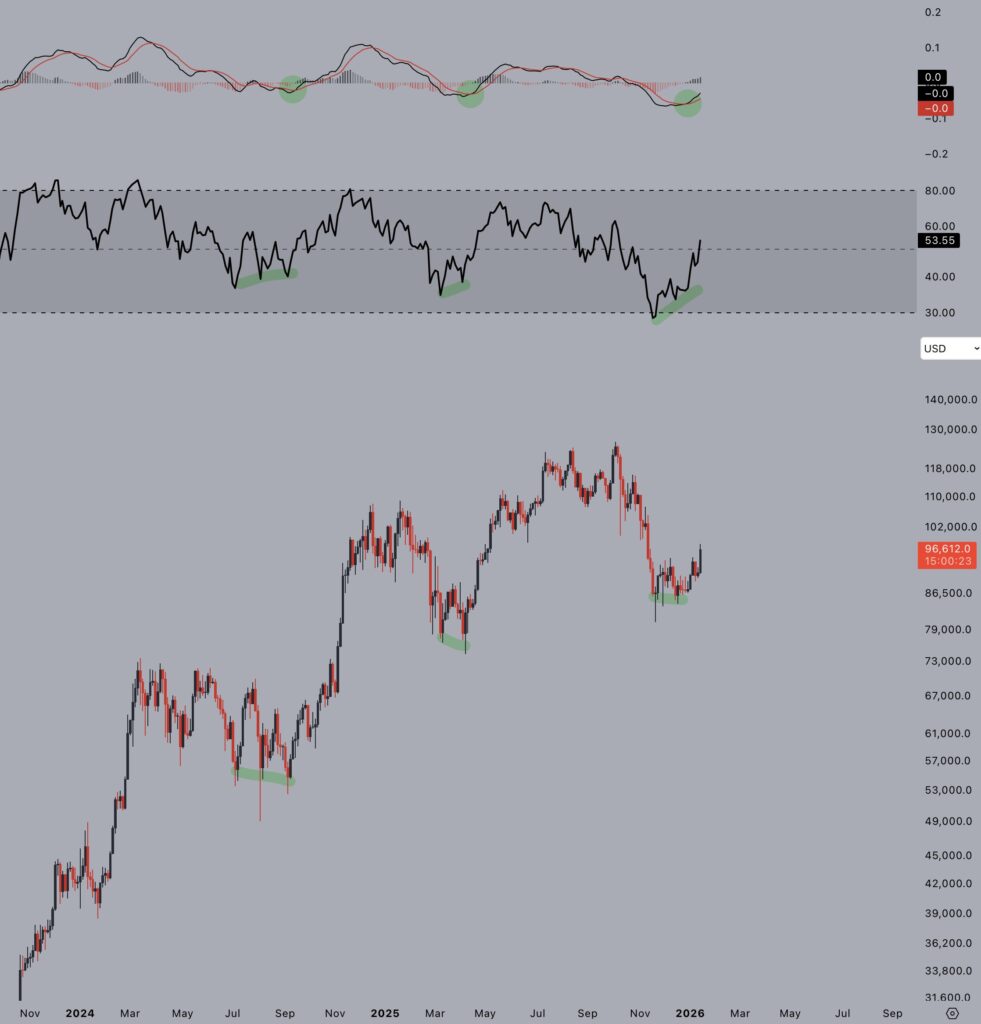
This setup often appears during trend continuation phases rather than market tops. A similar structure emerged on the four hour chart last week when Bitcoin successfully defended the $90,000 support level. That move set the stage for the current recovery, reinforcing the view that buyers are gradually regaining control.
RSI Moves Above Key Midpoint for First Time Since October
One of the more notable developments is the RSI moving back above its 50 midpoint. This has not happened since early October and is widely seen as a signal that bearish momentum has faded. Traders often view RSI above 50 as confirmation that an uptrend is forming rather than a temporary bounce.
Market analyst Jelle highlighted this shift while reviewing three day charts, stating that the move above 50 confirms the start of a new upward phase. The broader takeaway is that the technical environment now looks healthier than at any point in the past two months, with fewer signs of distribution and more evidence of accumulation.
Bullish MACD Cross Strengthens the Case
The moving average convergence divergence indicator is also supporting the bullish narrative. Bitcoin has printed a buy signal on the MACD across higher timeframes, adding weight to the RSI divergence already in play. When these two indicators align, traders often treat it as a reliable reversal or continuation signal.
According to Jelle, previous instances where Bitcoin formed both a bullish MACD cross and bullish divergence on the three day chart have marked important market bottoms. While short term pullbacks remain possible, the combination suggests that downside risk is becoming more limited compared to earlier in the quarter.
$101,000 and the 50 Week SMA Come Into Focus
As Bitcoin pushes higher, attention is shifting to the 50 week simple moving average, currently sitting near $101,000. This level carries extra significance because Bitcoin has never reclaimed the 50 week SMA during a bear market year. If the market is indeed in a broader bearish phase, a successful reclaim would mark a historical first.
Bitcoin investor Isiah pointed out that this makes the current setup unusual. He noted that price fell below the 50 week SMA in early November, and any move back above it without a sharp rejection would suggest that this cycle is behaving differently from past bear markets. Such a development could challenge the idea that 2026 will be a conventional down year for Bitcoin.
Bull Market Support Band Retest Could Be Pivotal
Another area drawing interest is the bull market support band, formed by longer term moving averages that often act as dynamic support during strong uptrends. At the moment, this band sits above current price levels and is moving lower as Bitcoin trades sideways to higher.
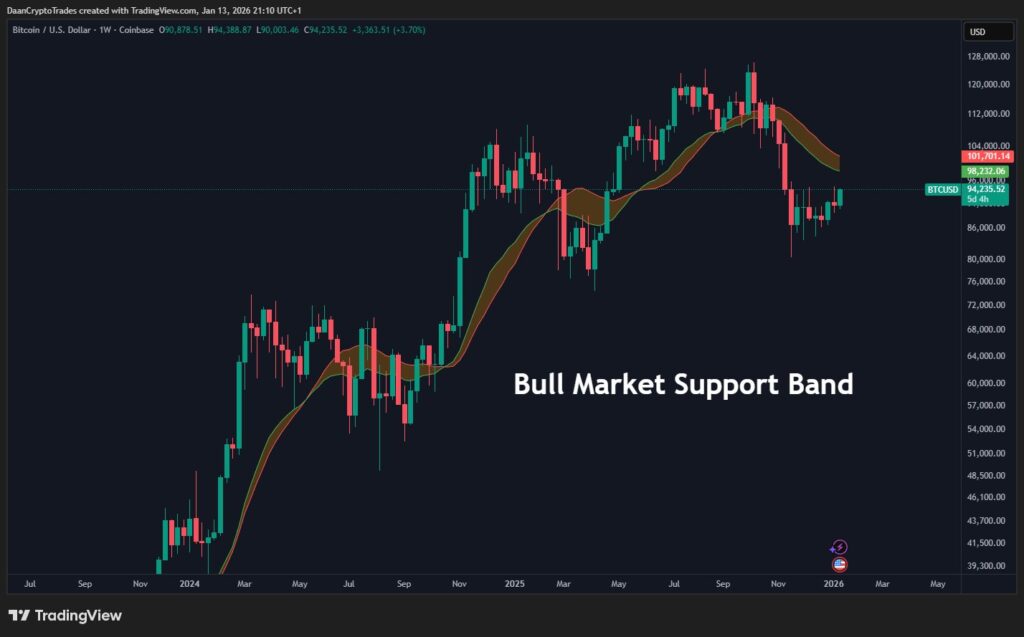
Trader Daan Crypto Trades believes a retest of this zone is likely in the near term. Historically, Bitcoin revisits this band during transitional phases. The reaction there could define market direction for weeks or even months. A clean break back above would strengthen the bullish case, while rejection could signal a longer consolidation period.
Market Outlook Remains Cautiously Optimistic
Overall, Bitcoin’s technical structure looks stronger than it has since the start of October. Momentum indicators are aligning, price is holding higher lows, and long term resistance levels are coming back into play. While reclaiming $101,000 remains a challenge, the persistence of bullish signals suggests that sellers are losing influence.
Traders remain cautious, aware that macro conditions and volatility can quickly shift sentiment. Still, with RSI and MACD pointing higher and key moving averages within reach, Bitcoin appears to be setting the stage for a potentially important move in the weeks ahead.
Leave a Reply