
Bitcoin (BTC) has taken a sharp bearish turn this week, falling below a crucial technical support level that once underpinned its rally. After reaching an all-time high of $126,110, the flagship cryptocurrency has slipped under the $109,500 zone, a level that previously acted as a strong base for buyers.
The move marks a significant shift in market sentiment, with technical indicators confirming the breakdown. The Relative Strength Index (RSI) has fallen below 50, while the Moving Average Convergence Divergence (MACD) has made a bearish crossover, both suggesting that downward momentum is now in play.
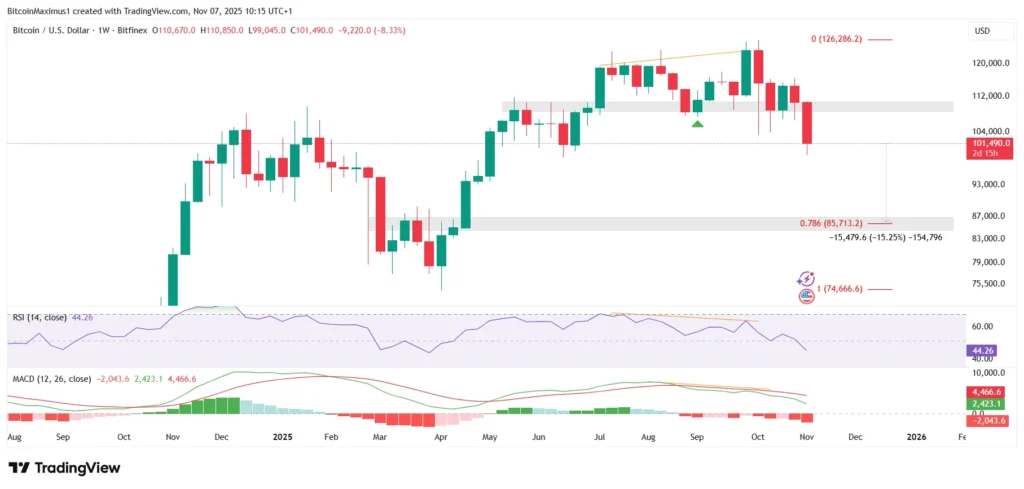
Traders are watching closely as Bitcoin closes below this pivotal threshold for the first time in months. Analysts warn that unless BTC reclaims $109,500, the next major support lies around $85,700, hinting at a potential 16% correction from current levels.
Technical Breakdown Confirms Bearish Momentum
On the weekly timeframe, the $109,500 zone has been a defining level for Bitcoin’s mid-cycle trajectory. In May 2025, it acted as resistance before flipping to support during the September retest, a move that fuelled the surge to $126,110. However, this time, the level failed to hold, with BTC decisively breaking below it.
The technical picture has since darkened. Both the RSI and MACD show strong bearish divergences, signalling weakening momentum even as price levels attempted to stabilise. The weekly candle close beneath the key horizontal area further validates a structural breakdown.
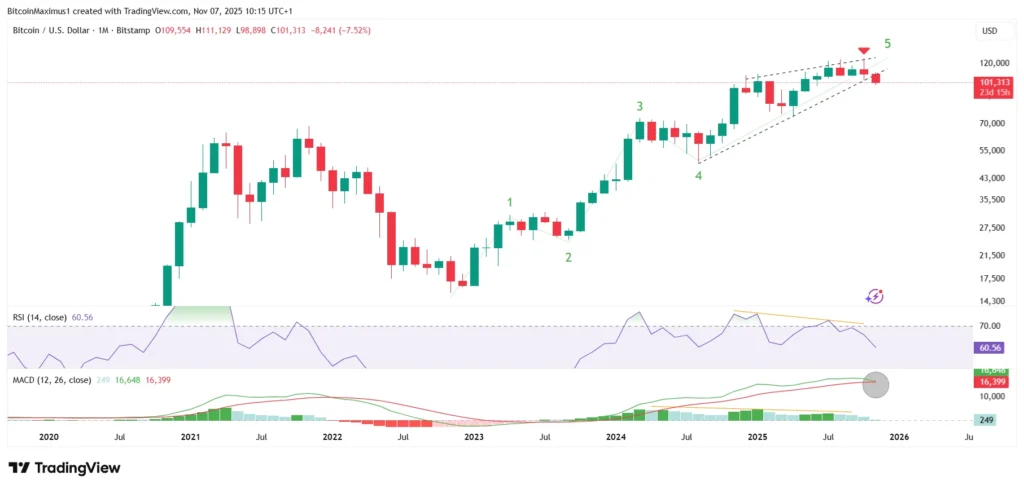
Adding to the bearish case, Bitcoin’s price pattern appears to have completed a five-wave upward cycle that began in November 2022. Wave five, analysts note, formed an ascending wedge, a classic “ending diagonal” pattern that often precedes a market reversal. With BTC now trading below that wedge, the technical formation points towards the end of the recent bull cycle.
Long-Term Indicators Suggest Cycle Top Is In
Several long-term indicators now hint that Bitcoin may have already topped out for this market cycle. The monthly candlestick for October closed as a shooting star, a formation typically seen at the end of extended uptrends.
Momentum metrics also confirm the shift: both RSI and MACD on the monthly chart are in bearish divergence, with the latter forming a negative cross. Historically, such configurations have marked the beginning of prolonged downtrends, most notably during the 2018 and 2021 cycle peaks.
Given these signals, analysts suggest that Bitcoin’s bullish phase may have concluded, setting the stage for a broader corrective phase before the next accumulation period. Unless BTC can swiftly reclaim lost territory and invalidate these bearish signals, the outlook for the remainder of the year remains negative.
Bullish Alternative: A Corrective Wave Scenario
Despite the prevailing pessimism, some analysts propose a bullish alternative rooted in Elliott Wave theory. This view interprets the recent decline as part of a larger A-B-C correction, where Bitcoin is currently completing wave C within an irregular flat pattern.
If accurate, BTC could still see a final leg lower, a wave five decline slightly below $98,944, before a potential rebound begins. This would coincide with the completion of a descending wedge, a structure that often signals trend reversal.
Under this scenario, Bitcoin could stabilise and stage a breakout back toward the $110,000 region, effectively confirming the end of its corrective cycle. However, this outcome remains speculative, as neither RSI nor MACD has shown any meaningful signs of a bullish reversal. Both indicators continue to fall, leaving traders cautious about premature optimism.
Bitcoin Dominance Strengthens Amid Market Weakness
Interestingly, while Bitcoin’s price has faltered, its market dominance, the percentage of total crypto market capitalisation it commands, is rising. The BTC Dominance Index (BTCD) recently broke out above 60.55%, validating the level as new support.
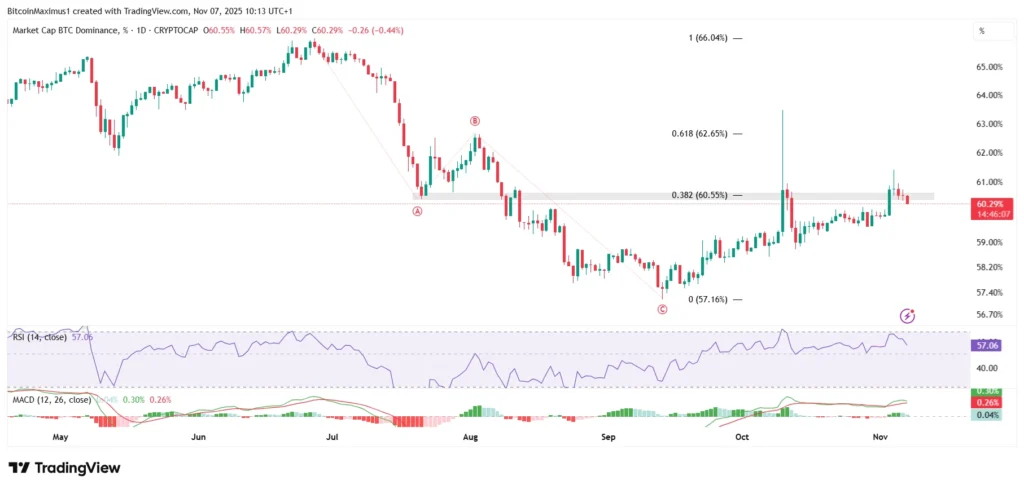
This breakout follows the completion of an A-B-C correction pattern in dominance charts, suggesting that Bitcoin’s share of the overall market is poised to climb further. Both the RSI and MACD for BTCD are rising, indicating strengthening momentum. Analysts forecast a potential move toward the 62.65% Fibonacci retracement level and possibly beyond.
Historically, Bitcoin dominance tends to increase during periods of market uncertainty, as traders rotate out of altcoins into the relative safety of BTC.
Outlook: More Pain Before Recovery
In summary, Bitcoin’s technical and momentum indicators point to a bearish continuation unless the $109,500 level is reclaimed. A fall toward $85,700 appears likely in the near term, reflecting a 16% downside from current prices.
While a corrective wave structure offers a glimmer of hope for bulls, confirmation of a reversal remains absent. Until such signals appear, traders should brace for continued downside volatility and potential market-wide corrections before any sustainable recovery can take shape.
Leave a Reply