The crypto market, after enjoying an extraordinary rally earlier this year, is now flashing multiple warning signs of a deeper correction. Having touched a historic peak of $4.17 trillion in August, the market has since cooled off with a pullback exceeding 10%. Analysts remain divided on whether this downturn is a healthy reset or a precursor to a much larger decline.
A Bull Run Losing Steam
The ongoing bull cycle has been one of the most explosive in the sector’s history, lifting the total market capitalisation of cryptocurrencies by nearly 500%. The surge culminated in early August, with the global crypto market hitting an all-time high of $4.17 trillion.
However, the euphoria has since given way to uncertainty. Over the past few weeks, momentum has stalled, leading to a retracement of more than 10%. While such corrections are not unusual in a strong uptrend, several technical indicators are beginning to paint a worrying picture for investors.
Technical Red Flags on the Horizon
One of the most pressing concerns stems from the long-term chart of TOTALCAP, which tracks the overall crypto market capitalisation. Analysts suggest that TOTALCAP is in the fifth and final wave of its upward trajectory. This final wave has formed into an ending diagonal pattern, a structure that historically signals exhaustion before a major correction.
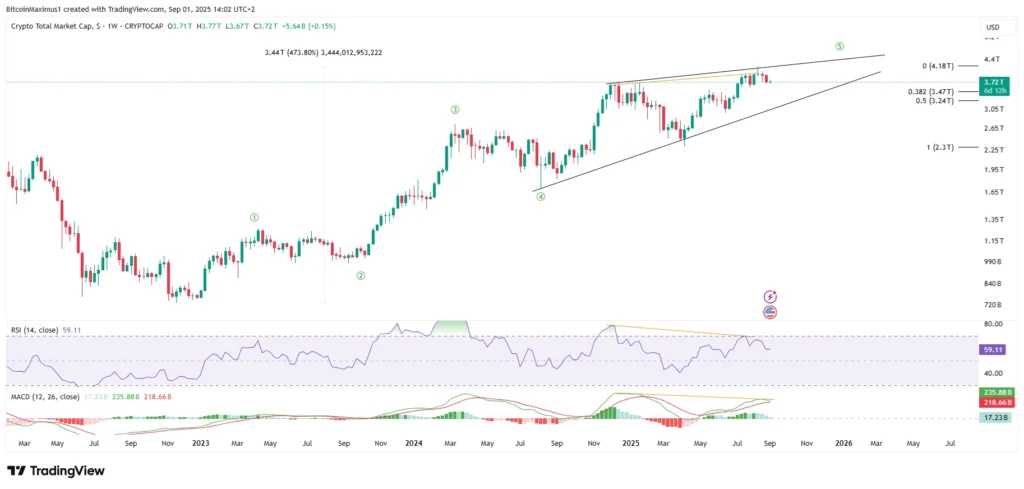
Compounding these concerns, the price action has also created an ascending wedge, another well-known bearish pattern. Adding to the list of red flags, both the Relative Strength Index (RSI) and the Moving Average Convergence/Divergence (MACD) have shown bearish divergences. Such divergences are rare in long-term charts and often herald trend reversals of significant magnitude.
Notably, these signals are aligning with the end of wave five, which further supports the hypothesis that the crypto market may be approaching a critical turning point.
Short-Term Correction Still in Play
Despite the broader bearish signals, the short-term outlook offers some optimism. The current decline has unfolded within a descending wedge pattern, which is generally interpreted as a corrective, rather than impulsive, move. TOTALCAP is now testing the support trend line of this wedge and sitting near the $3.71 trillion 0.382 Fibonacci retracement level, a zone considered ideal for a potential bullish reversal.
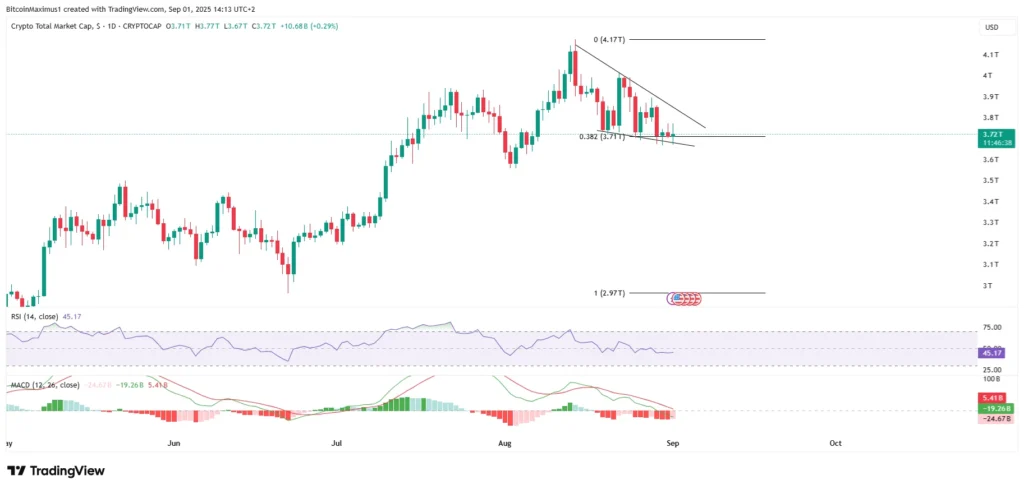
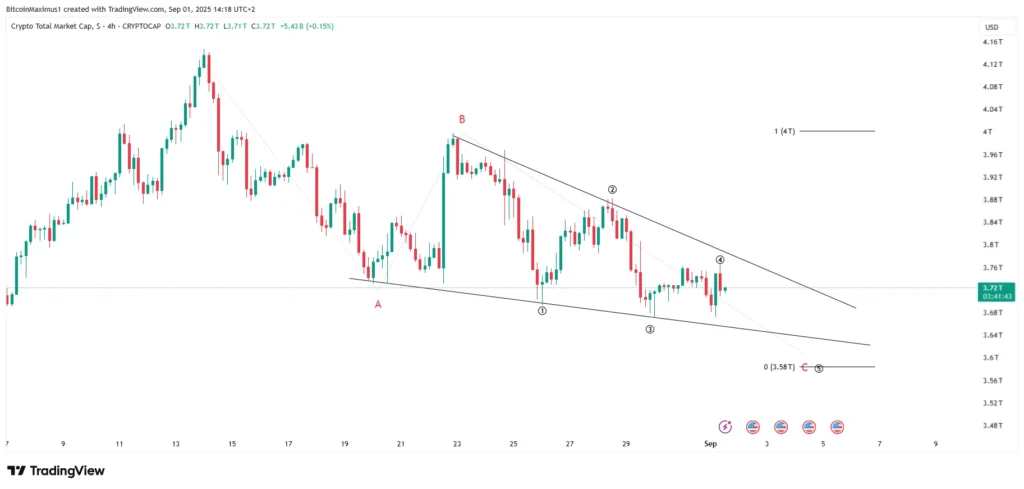
The convergence of these support levels indicates that the bottom of this correction may be close. Yet, momentum indicators remain weak, with both RSI and MACD still in decline. The ongoing wave count suggests that the market is finalising wave C of an A-B-C correction. If waves A and C are equal in length, the eventual bottom could be near $3.52 trillion, potentially resulting in a brief throwover below the wedge before recovery begins.
Correction Nearing Its Endgame
Although the immediate market mood is cautious, there are reasons for optimism in the medium term. The correction appears to be nearing completion, with several strong technical support levels aligning. This creates the possibility of one final upward push before the current market cycle ultimately peaks.
Investors, however, should tread carefully. The technical outlook implies that while a near-term rally could materialise once the correction concludes, the larger picture still suggests that the market is in its final phase of growth. That means a significant correction, potentially deeper and more prolonged could follow once this last rally plays out.
The crypto market stands at a crossroads: either it has entered a healthy consolidation before resuming its upward march, or it is on the cusp of a larger bearish reversal. With momentum indicators weakening and bearish divergences flashing, the risk of a steeper downturn cannot be ignored.
Still, with critical support levels holding firm, a short-term rebound remains on the cards. Investors will be watching closely to see whether the anticipated bottom forms near $3.52 trillion or if the current support around $3.71 trillion proves sufficient.
Leave a Reply