
The crypto market has taken a sharp downturn, leaving investors questioning whether this is a temporary dip or the start of a deeper correction. After peaking at a total market capitalisation of $4.17 trillion in August, prices have retreated significantly, with Ethereum (ETH) and Solana (SOL) among the hardest hit.
A Market Warning from the Charts
The recent slide began shortly after TOTALCAP, the total market capitalisation of cryptocurrencies, touched its August peak. That peak left behind a long upper wick and a “shooting star” candlestick, both classic technical warning signs that bullish momentum could be running out of steam.
Initially, the move looked like a small pullback. However, what began as a dip quickly escalated into a sharp decline, now lasting several days. With more than five days remaining before the weekly close, analysts are increasingly cautious.
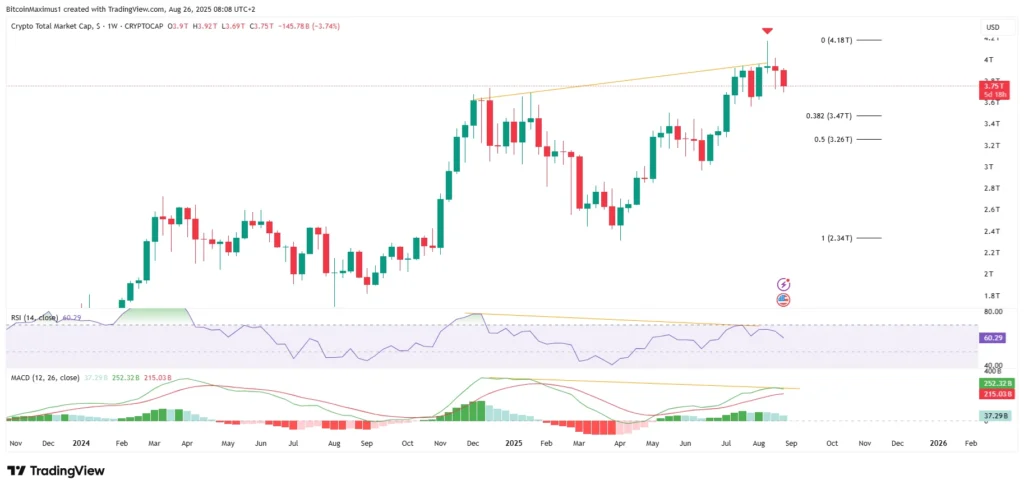
If selling pressure continues, the market risks forming a large bearish candle, which could open the door to deeper retracements. Key support levels sit around $3.47 trillion and $3.26 trillion, based on Fibonacci levels.
Technical indicators confirm this weakening outlook. Bearish divergences have appeared in both the Relative Strength Index (RSI) and the Moving Average Convergence Divergence (MACD). If the RSI drops below 50 and the MACD makes a bearish cross, the case for a longer correction will only strengthen.
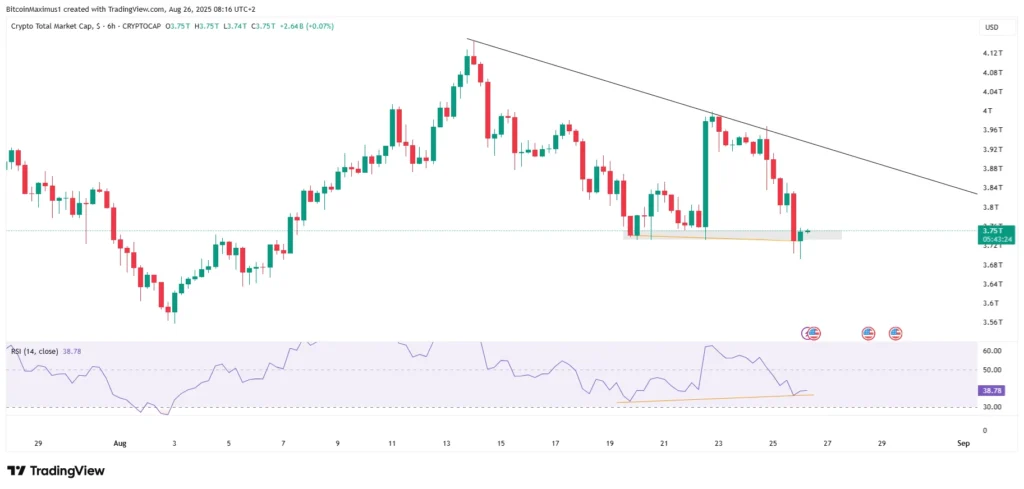
Still, the short-term charts offer a glimmer of hope. On the six-hour timeframe, TOTALCAP has swept its August lows, creating the potential for a relief rally. If momentum picks up, a recovery toward the $3.8 trillion resistance zone is possible. Yet most analysts agree that unless momentum shifts dramatically, another leg lower remains the more likely outcome.
Altcoins Take the Biggest Hit
While Bitcoin has also suffered in the downturn, the real pain has been felt in the altcoin market. The altcoin market capitalisation (ALTCAP) shows no signs of reversing its downward trend.
In August, altcoins formed a double top pattern, often a precursor to further weakness. This pattern, combined with long upper wicks and bearish divergences in both the RSI and MACD, paints a negative technical picture.
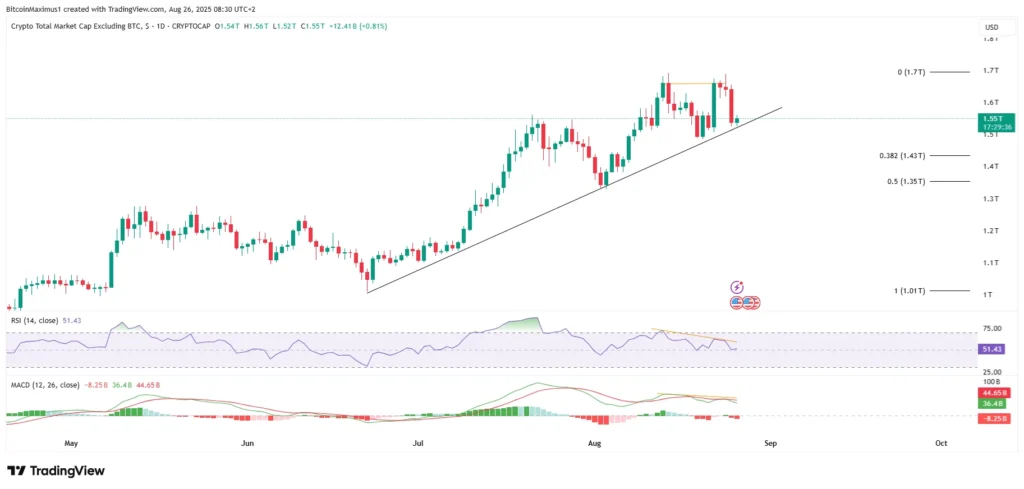
Currently, the altcoin market sits on an ascending support trend line. However, analysts warn that once this line breaks, losses could accelerate. Targets of $1.43 trillion and even $1.35 trillion are in focus if support gives way.
Adding to the bearish case, momentum indicators suggest further downside. Both the RSI and MACD are expected to dip below 50 and 0 respectively, which would confirm that selling pressure is likely to persist.
Ethereum Pulls Back
Ethereum’s recent performance highlights why altcoins are dragging the broader market lower. The world’s second-largest cryptocurrency posted a large bearish engulfing candlestick this week, signalling strong downward pressure.
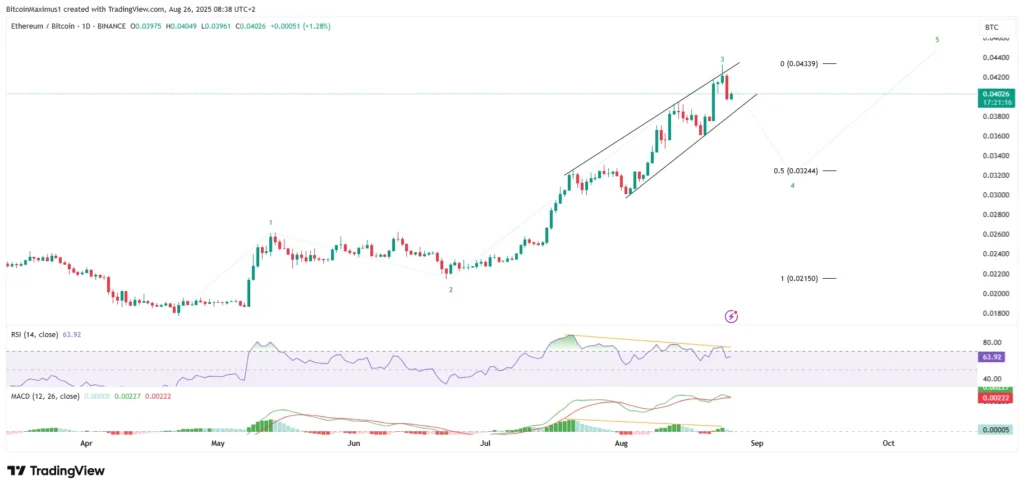
Like the broader altcoin index, Ethereum has also formed a double top. Technical wave counts suggest that ETH may have completed the third wave of its five-wave upward cycle, meaning a corrective fourth wave could now be underway.
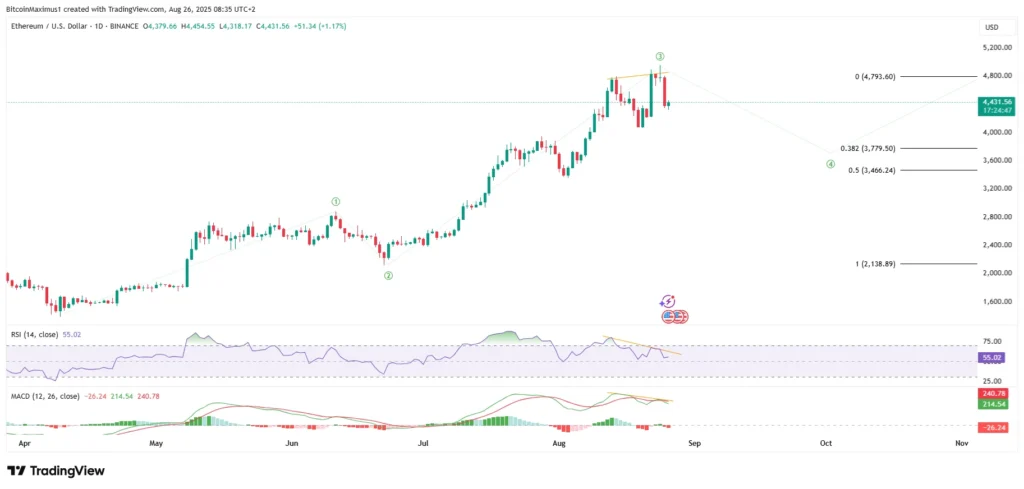
Key support levels for ETH are between $3,446 and $3,780, drawn from the 0.382–0.5 Fibonacci retracement levels. If these levels fail to hold, the correction could deepen.
Against Bitcoin, Ethereum has also shown signs of weakness. The ETH/BTC pair is trading within an ascending wedge pattern, a formation that often leads to a breakdown. If this happens, ETH could fall to ₿0.032 before resuming its longer-term uptrend.
In short, Ethereum looks set for a period of cooling off, likely losing ground to Bitcoin in the near term.
What’s Next for Crypto?
The market outlook remains uncertain, but the weight of evidence points towards a bearish trend. Technical indicators, broken support levels, and the sharp altcoin sell-off suggest that further downside is possible.
A short-term bounce cannot be ruled out, particularly given the oversold conditions in some areas of the market. If momentum picks up, TOTALCAP could retest resistance around $3.8 trillion. However, without strong buying support, most analysts expect the next significant move to be downward, targeting the $3.26 trillion–$3.47 trillion zone.
For investors, the coming weeks will be crucial. Whether this decline turns out to be a temporary pullback or the start of a deeper correction will depend on how the market reacts at these critical support levels. Until then, caution appears to be the prevailing sentiment.
Leave a Reply