
Curve DAO (CRV), one of the more volatile tokens in the decentralised finance (DeFi) sector, has seen dramatic price swings over recent months. Following a steep correction of around 35%, traders are closely watching whether CRV will stabilise and mount a bullish comeback, or whether further downside awaits. Technical indicators suggest the token is at a critical juncture, with both bullish and bearish scenarios still possible.
A Volatile Journey Since Breakout
On the weekly time frame, CRV has been on a rollercoaster since breaking out from a descending resistance trend line in November 2024. That breakout sparked a parabolic surge, driving the price to $1.34 in December, a staggering gain of nearly 500% from its pre-breakout levels.
However, the excitement proved short-lived. The token quickly gave up much of its gains, sliding back toward the very diagonal resistance it had only just cleared. Since then, CRV has moved into consolidation, trading inside a symmetrical triangle. This has left the market at an impasse, with neither bulls nor bears yet able to dictate the next decisive move.
The $1.20 level has emerged as a formidable barrier. Even if CRV manages a breakout from its current formation, this resistance could cap any immediate upside. At the same time, momentum indicators paint a mixed picture. The Relative Strength Index (RSI) sits at 50 signalling neutrality, while the Moving Average Convergence/Divergence (MACD) remains positive but hovers near a bearish crossover.
In short, the weekly chart reflects indecision, making it essential to zoom in on lower time frames for more clarity.
Bullish Case: Wedge Breakout in Play
From a bullish perspective, CRV’s decline since its July highs may have formed a descending wedge, a pattern often considered a precursor to upward reversals. The structure of this correction supports the case for a rebound.
Notably, the corrective move appears to have unfolded in an A-B-C formation, with waves A and C showing symmetry in length. Moreover, the decline halted precisely at the 0.618 Fibonacci retracement level, a historically significant support zone that often precedes bullish reversals.
Momentum indicators add further weight to the bullish outlook. Both the RSI and MACD have flashed bullish divergence, a signal that selling pressure may be exhausted and that a reversal could be imminent. If CRV can break out of this wedge pattern decisively, it would confirm the bullish wave count and open the door for a meaningful rally.
Bearish Case: Symmetrical Triangle to Dominate
The opposing scenario, however, cannot be dismissed. On the weekly chart, the symmetrical triangle appears more in line with price action, particularly given CRV’s slip below the $0.85 horizontal support zone. This area, once a solid floor, is now likely to act as resistance and could weigh on any upward attempts.
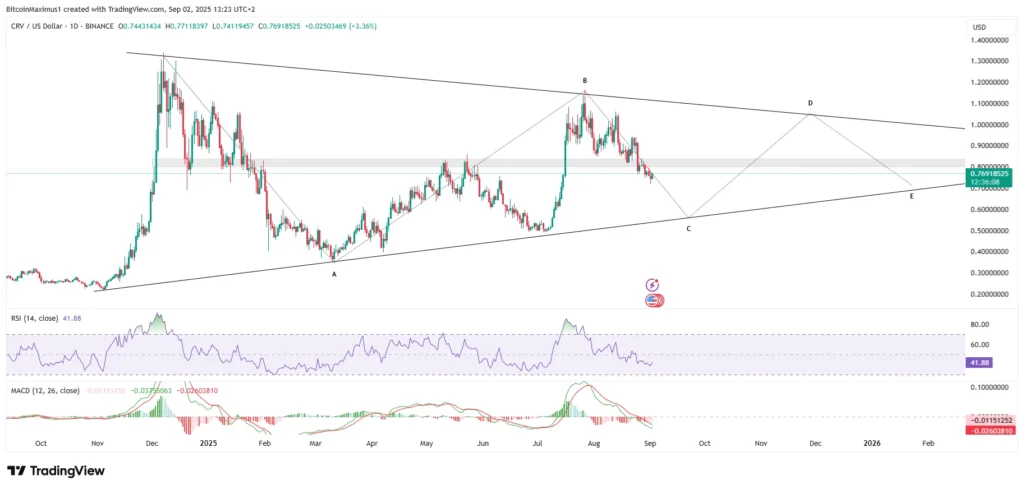
Adding to the bearish sentiment, both the RSI and MACD are trending downwards, hinting that bears may still have the upper hand. If this outlook proves accurate, CRV could continue its gradual decline toward the triangle’s lower support trend line at $0.68. Under this scenario, traders may not see a decisive breakout until as late as 2026, leaving the token stuck in extended consolidation.
Critical Zone: What Traders Should Watch
With two opposing counts in play, CRV is at a crucial inflection point. Bulls must push the price above the descending wedge and reclaim levels above $0.85 to validate the reversal narrative. Failure to do so would leave bears in control, potentially dragging the token lower over the coming months.
Until one side prevails, volatility is the only certainty. Traders should brace for sharp moves in either direction as CRV hovers near its make-or-break zone.
For now, the token sits on a knife edge, its next chapter to be written by whether buyers can muster the strength for a breakout or sellers succeed in extending the correction.
Leave a Reply