
In a market where most cryptocurrencies stumbled, Curve DAO’s CRV stood tall. Over the past 24 hours, the broader crypto market dropped over 4%, triggering sell-offs across major altcoins. Yet CRV printed a bullish daily candle, even kicking off a modest recovery today.
Historically, when altcoins show resilience during heavy corrections, they often lead the rally once market sentiment turns. CRV’s performance is now drawing attention as traders look for clues on where the next breakout may occur. Could this be a sign that CRV is preparing to lead the next bullish wave?
Long-Term Range Still Intact
For almost three years, Curve has moved inside a horizontal range between $0.42 and $0.83. While there were brief breakouts, none of them led to sustained gains. Most upswings were followed by a swift drop back into the same channel.
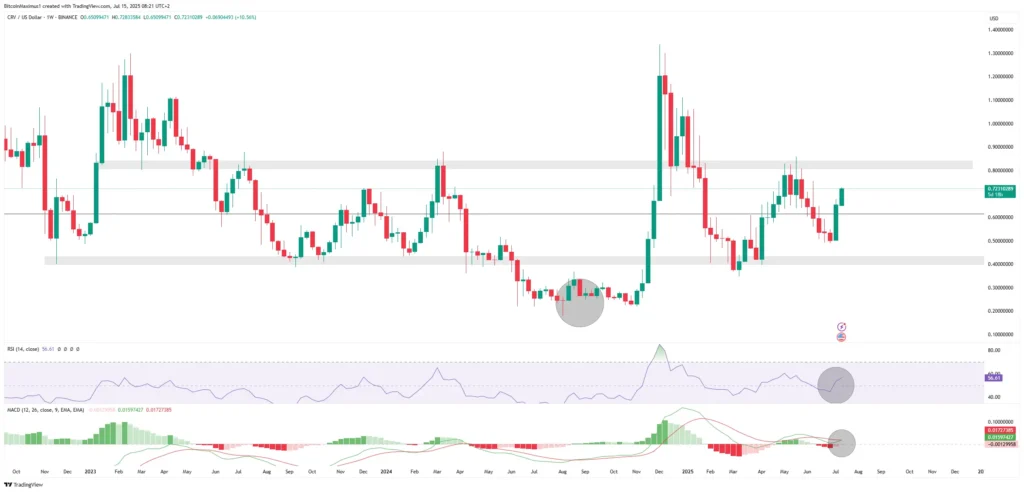
A notable exception occurred between June and November 2024, when CRV dropped below $0.42, forming a temporary lower range. This move raised fears of a prolonged bearish phase, but the dip proved to be a fakeout. Soon after, CRV rebounded sharply, pushing back into its familiar range.
Since then, Curve has been climbing steadily. It’s now trading in the upper half of the range and pressing against the $0.83 resistance level, an area that has held firm for years. If this level is broken and sustained, CRV could be headed for a powerful breakout.
Momentum Signals Support Bullish Outlook
Technical indicators are currently favouring the bulls. The Relative Strength Index (RSI) has crossed above 50, showing increasing buying pressure. Meanwhile, the Moving Average Convergence Divergence (MACD) has made a bullish crossover, an early sign of a potential rally.
If the current momentum continues, Curve could finally break above the $0.83 ceiling. Once above, the token may enter a parabolic phase and target multi-year highs beyond the $1 mark.
Such a move would not only validate the recent strength but could also attract further attention from traders and investors.
Elliott Wave Structure Points to Bigger Move
From a structural standpoint, the recent price action fits within Elliott Wave theory. Analysts suggest CRV completed a five-wave upward rally, followed by a clean A-B-C corrective phase. This correction has now given way to a potential new five-wave impulse move.
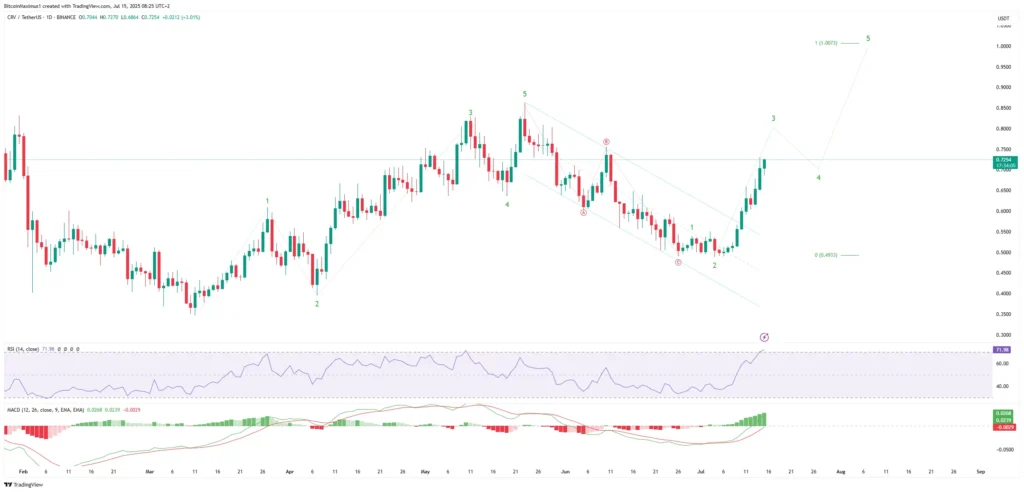
The breakout that began on July 11 may mark the start of this new upward trend. If so, CRV could be entering wave three of a larger bullish cycle, a phase that typically brings the strongest price gains.
Whether this is wave three or just a wave C rally, both scenarios point to a likely move toward $1. The market’s response at that price point will help determine whether this rally has longer legs or needs more consolidation.
Breakout Within Reach
CRV has shown clear strength in a weak market, defying the pullback with a bullish structure and strong momentum. Its ability to hold the range high and press against long-term resistance could be the setup for a breakout that’s been years in the making.
If CRV manages to push past $0.83 and sustain it, traders should watch closely. A decisive breakout could open the door to a major rally, especially if the wider market begins to recover. All signs point to CRV positioning itself as one of the early movers in the next bullish leg.
Leave a Reply