
Ethereum is confronting fresh downside risk after a critical technical indicator signalled a potential trend reversal. The moving average convergence divergence (MACD) on the weekly chart has switched to bearish, a pattern that previously preceded significant price declines of up to 60 percent. Analysts warn that unless Ether holds the crucial $4,000 support level, deeper losses may follow.
Historical Bearish Cross Signals Raise Alarm
The MACD indicator, widely used to assess trend strength and momentum, has generated a bearish cross on Ethereum’s weekly chart. This occurs when the MACD line moves beneath the signal line, historically indicating weakening momentum.
In past cycles, such signals have triggered steep corrections. Ethereum lost nearly 46 percent in mid-2024 following a similar signal, and more than 60 percent in early 2025. Market watcher CRYPTO Damus noted concern over the recent shift, stating that previous bearish MACD crosses resulted in major downturns.
Another analyst, Titan of Crypto, advised traders to stay alert and prepare for multiple scenarios if the bearish signal gains confirmation in the coming sessions.
Critical Support at $4,000 Under Threat
Ethereum currently trades near $3,900, closely testing the key $4,000 support level. This zone has acted as a resilient floor since early August. Bulls must defend this price to sustain hopes of an eventual recovery and continuation toward the $5,000 mark.
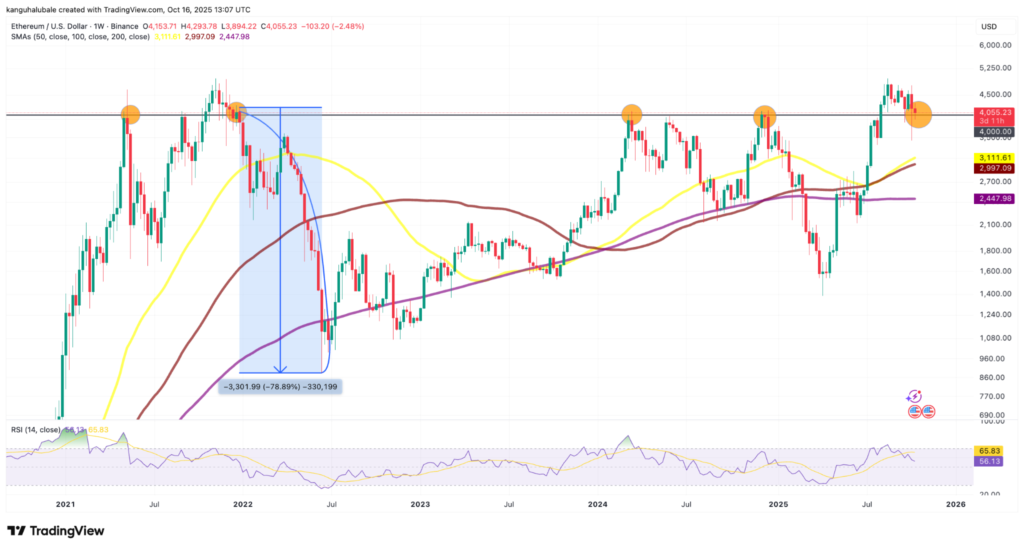
Historical data reinforces its importance. The last decisive break under $4,000, in late 2021, preceded a dramatic 78 percent decline, with ETH bottoming near $880 during the 2022 bear market. Elliott Wave analyst Man of Bitcoin remarked that maintaining support at $3,899 keeps an upward move possible, while a breach could trigger a deeper corrective wave.
Analysts Warn of Potential Breakdown
Trader Koala described Ethereum as being in a “weekly breakdown and trend loss” phase after losing the $4,200 support. The market structure, according to several analysts, now leans bearish unless momentum shifts quickly.
Sentiment has clearly flipped. Bears are targeting the lower boundary of a descending channel around $3,745 on the daily chart. A fall through this level could accelerate selling pressure, heightening the chance of cascading losses.
Market Outlook Hinges on Momentum Shift
While near-term signals appear negative, some analysts remain cautiously optimistic about the long-term trajectory. They suggest that any significant dip could offer accumulation opportunities ahead of a potential future rally.
However, traders are advised to monitor technical indicators closely. A confirmed weekly close below $4,000 would likely validate the bearish cross and open the door to further declines. Conversely, a strong defence of support could weaken bearish momentum and restore confidence among buyers.
What Comes Next for Ethereum?
Ethereum faces a decisive moment as technical charts point to increased volatility. A sustained hold above key support may allow a reversal toward previous highs. Failure to do so could mirror past downturns triggered by similar MACD signals.
Investors now look to upcoming weekly closes and broader market sentiment to determine Ethereum’s next direction. Until clarity emerges, caution remains the dominant theme among analysts and traders.
Leave a Reply