
Ethereum (ETH) has surged back above the $4,100 mark, igniting bullish sentiment across the market and signalling the possibility of fresh all-time highs in the coming weeks. After bouncing strongly from critical support, the world’s second-largest cryptocurrency is now testing major resistance levels, with technical indicators and wave counts pointing to further gains ahead.
Strong Rebound From Key Support
Ethereum’s recent rally has been fuelled by its decisive reclaim of the $3,950 horizontal support zone, a level that has historically dictated the token’s trajectory. Back in 2021, a breakout above this same zone propelled ETH to its then all-time high of $4,877 in November. However, that move proved to be a deviation, as Ethereum quickly fell below the threshold, confirming it as resistance.
Over the years that followed, ETH made three failed attempts to break back above the level, before finally clearing it in August 2025. That breakout carried Ethereum to a fresh high of $4,957. The most recent price dip was therefore seen as a critical retest and last week’s rejection of lower levels has strengthened the bullish case.
On the weekly chart, Ethereum printed a long lower wick, showing strong buyer demand at support. This has been followed by a bullish engulfing candlestick, a classic reversal signal that often precedes sharp upside moves.
Technical Indicators Signal Strength
Momentum indicators are also aligning with the bullish structure. The Relative Strength Index (RSI) has held firmly above the neutral 50 level without flashing any bearish divergence, while the Moving Average Convergence/Divergence (MACD) remains in positive territory.
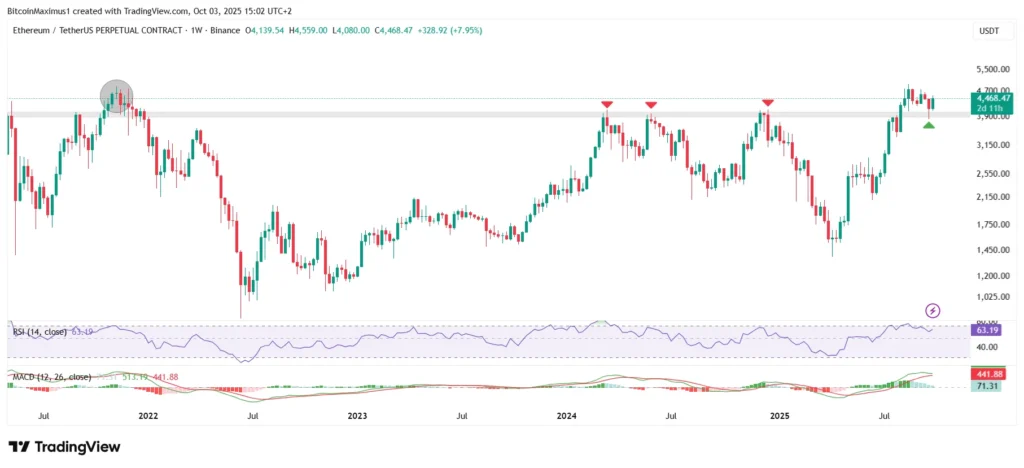
Such resilience is notable given Ethereum’s strong rally since April 2025. The absence of bearish divergences indicates that momentum is still intact and that the market is capable of sustaining higher levels. Analysts point out that as long as ETH remains above the $3,950 support, its long-term outlook remains decisively bullish.
The price action has also confirmed a classic breakout and retest structure, where former resistance has now flipped into support. This pattern often lays the foundation for sustained rallies, particularly when coupled with strengthening momentum signals.
Wave Count Suggests Final Impulse Higher
Beyond traditional indicators, Ethereum’s Elliott Wave count also paints a bullish picture. Since April 2025, ETH has been advancing in a five-wave upward structure. The recent retracement is believed to mark the completion of wave four, a shallow correction that perfectly aligned with the 0.382 Fibonacci retracement level.
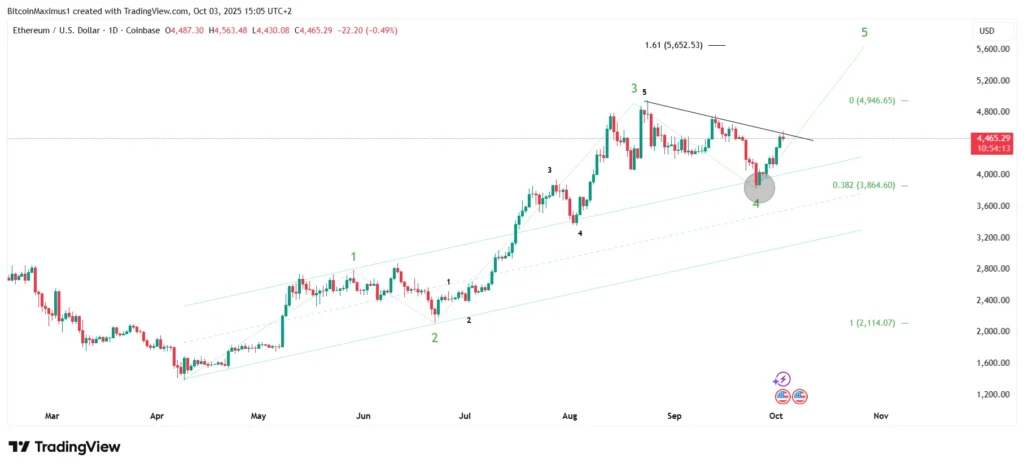
Wave four’s structure contrasts with the deeper correction of wave two, providing the necessary alternation expected within Elliott Wave theory. With this stage complete, Ethereum now appears ready to embark on its fifth and final impulse wave.
If the count holds, wave five could drive ETH to at least $5,652, corresponding to the 1.61 external Fibonacci retracement level. To confirm this scenario, Ethereum must decisively break out of its diagonal resistance trend line, which has capped the price since its all-time high. A weekly close above this barrier could set the stage for a powerful rally with limited resistance overhead.
Ethereum vs Bitcoin: Parallel Moves
The ETH/BTC trading pair offers additional confirmation of Ethereum’s bullish structure. Much like the USD chart, the pair appears to have completed its wave four correction at the 0.382 Fibonacci retracement level of ₿0.035.
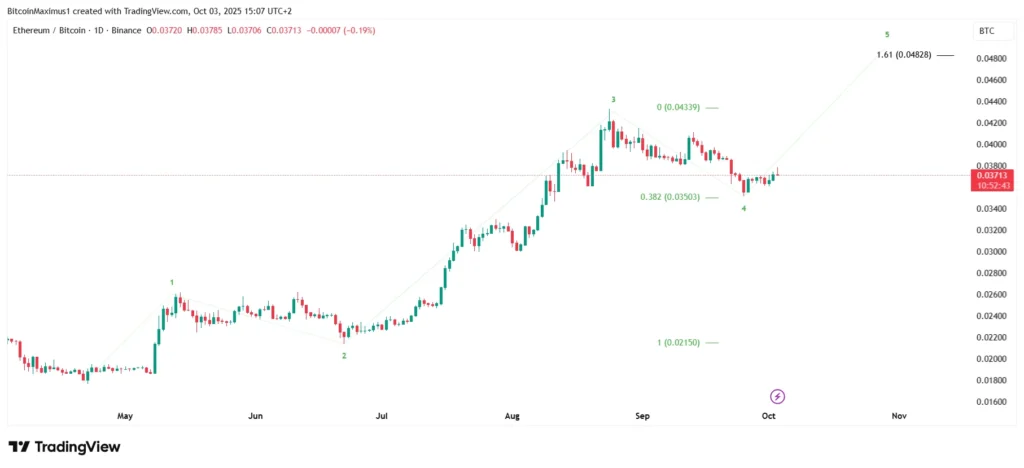
This suggests Ethereum is poised for a final upward leg against Bitcoin, potentially carrying it towards ₿0.048. However, analysts caution that ETH’s long-term trend versus Bitcoin remains broadly bearish, meaning the upcoming move may prove to be the last significant push before relative weakness resumes.
Nonetheless, the prospect of Ethereum outperforming Bitcoin in the short term is adding to the confidence of traders seeking to ride the October rally.
October Outlook: Breakout Within Reach
All eyes are now on the $4,250 resistance level, which represents the final obstacle before Ethereum enters uncharted territory. A decisive breakout above this zone, especially if accompanied by strong volume, would confirm the bullish reversal and pave the way for a push beyond $5,600.
October has historically been a month of heightened volatility in the cryptocurrency market and this year appears no different. With Bitcoin consolidating near its own highs and Ethereum showing clear signs of strength, market participants are increasingly positioning for a breakout-driven rally.
Should Ethereum maintain its hold above $3,950 and clear $4,250, analysts argue the path towards new highs will be wide open. A move into price discovery territory could also ignite fresh institutional interest, especially as Ethereum continues to strengthen its role in decentralised finance (DeFi), staking and blockchain infrastructure.
Ethereum’s recovery above $4,100 has re-energised bullish sentiment, with both technical indicators and wave analysis pointing towards one final leg higher in the current cycle. With $3,950 now firmly established as support and momentum indicators showing no signs of fatigue, the case for a breakout remains strong.
As October unfolds, Ethereum stands on the brink of reclaiming price discovery territory. If the $4,250 resistance falls, a surge towards $5,652 and potentially beyond, could follow. Traders and investors alike are watching closely, as Ethereum’s October rally may be the catalyst that propels it into a new era of all-time highs.
Leave a Reply