
Ethereum (ETH), the world’s second-largest cryptocurrency, is facing mounting pressure after slipping below the $4,000 support level for the first time since August. The decline has shaken investor confidence, as the token lost 13.86% over the past seven days, igniting concerns that ETH may be entering the early stages of a prolonged bearish cycle.
Bullish Setup Turns Bearish
On the daily chart, Ethereum appeared to be consolidating within a bull flag pattern, a formation that usually points to an upside continuation. Analysts had anticipated a breakout toward the $5,000 region if the setup held.
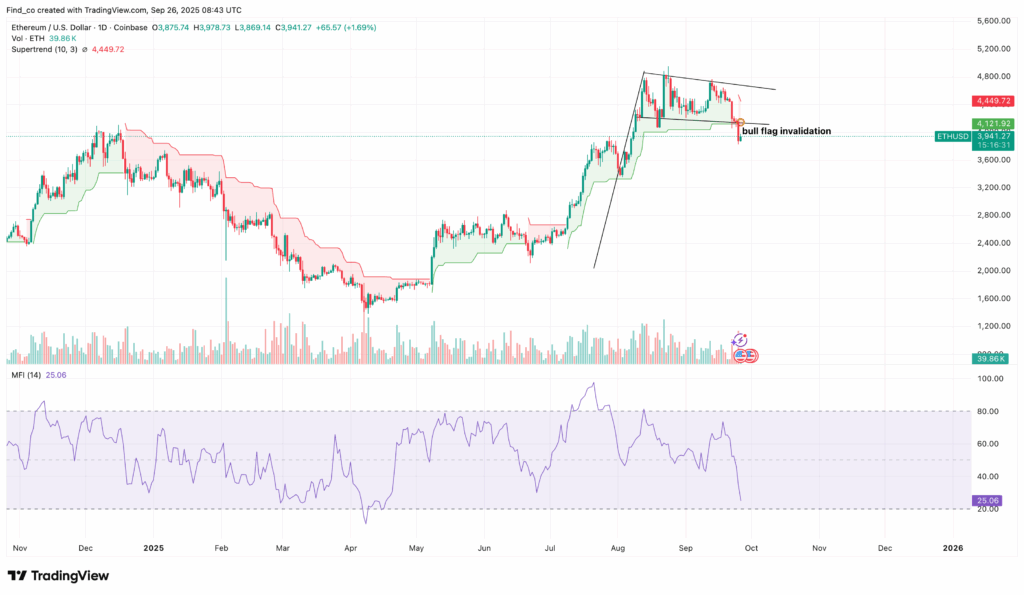
Instead, the price collapsed below the lower boundary of the flag, invalidating the bullish structure and flipping it into a bearish signal. This technical breakdown has reinforced the downside case for ETH, suggesting that bears are firmly in control of the market in the short term.
Adding to the negative outlook, the Supertrend indicator has turned red, a classic warning sign of increased selling momentum. The Money Flow Index (MFI) has also dipped to 25.06, placing Ethereum in oversold territory. While this suggests the asset could be primed for a relief bounce, the broader trend currently points to further weakness.
On-Chain Data Reflects Rising Risk
Beyond the charts, on-chain metrics are flashing warning signals. Analysts are closely watching the Market Value to Realised Value (MVRV) Long/Short Difference, which compares unrealised profits of short-term versus long-term holders.
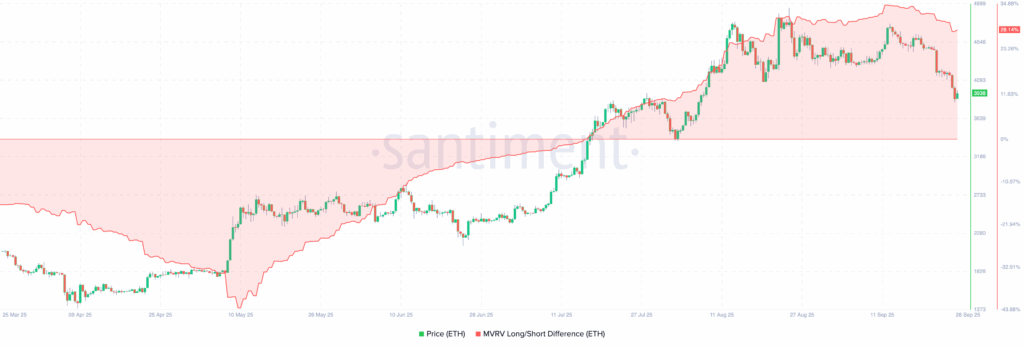
At present, the metric stands at 28.14%, showing that short-term traders are sitting on significantly higher unrealised profits than long-term holders. Historically, such readings have triggered selling pressure, as traders lock in gains, amplifying downside momentum.
If the MVRV ratio continues to climb, Ethereum may face increased risks of sustained selling, a scenario reminiscent of the 2022 bear market, which began with a series of failed supports and extended losses across the sector.
Key Levels to Watch
Technical patterns on the 4-hour chart also point to further declines. ETH has broken below the neckline of a head-and-shoulders pattern, a classic reversal setup that signals a potential deeper downtrend.
Losing this neckline highlights the dominance of sellers, with price targets now shifting toward the 0.236 Fibonacci retracement level at $3,731. A failure to defend this level could open the door to steeper declines, potentially sending ETH down to $3,353.
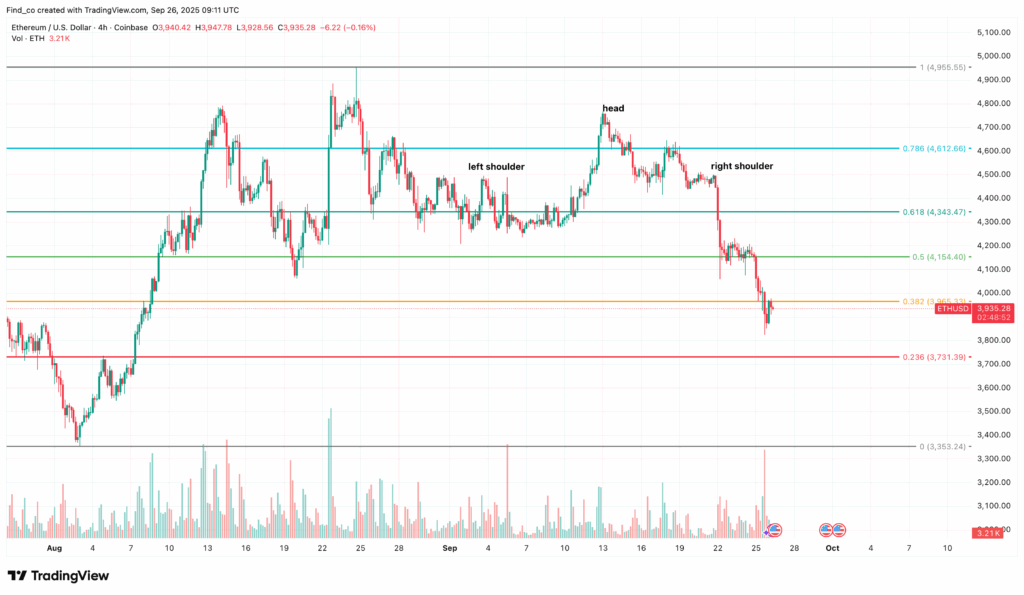
On the upside, bulls will need to stage a strong recovery above the immediate support at $3,965. Regaining this threshold may enable ETH to rebound toward $4,343, but the momentum required appears limited without renewed demand and investor confidence.
Bear Market or Bear Trap?
The current setup poses a crucial question for traders: is Ethereum entering a true bear market, or is this a temporary shakeout before a rebound?
The answer lies in whether buying demand returns strongly in the coming days. Oversold indicators like the MFI suggest a short-term bounce is possible, but the broader mix of bearish chart patterns, on-chain signals and the loss of key psychological levels weigh heavily on market sentiment.
Unless ETH can reclaim $4,000 swiftly, analysts warn that the decline could mirror the early stages of the 2022 downturn, where support levels steadily broke, leading to a prolonged cycle of weakness.
For now, Ethereum remains on edge and all eyes are on whether the bulls can defend critical support or if the bears will continue to drive the market lower.
Leave a Reply