Solana (SOL) witnessed a sharp price rally on June 16, surging by 9.5% to reach $157, up from $144 just a day earlier. The surge in momentum is largely attributed to rising optimism around the potential approval of a spot Solana ETF and strong demand in the derivatives market. The daily trading volume also doubled within 24 hours, soaring to $4.5 billion, reflecting heightened buying pressure.
Optimism Builds Around Spot Solana ETF Approval
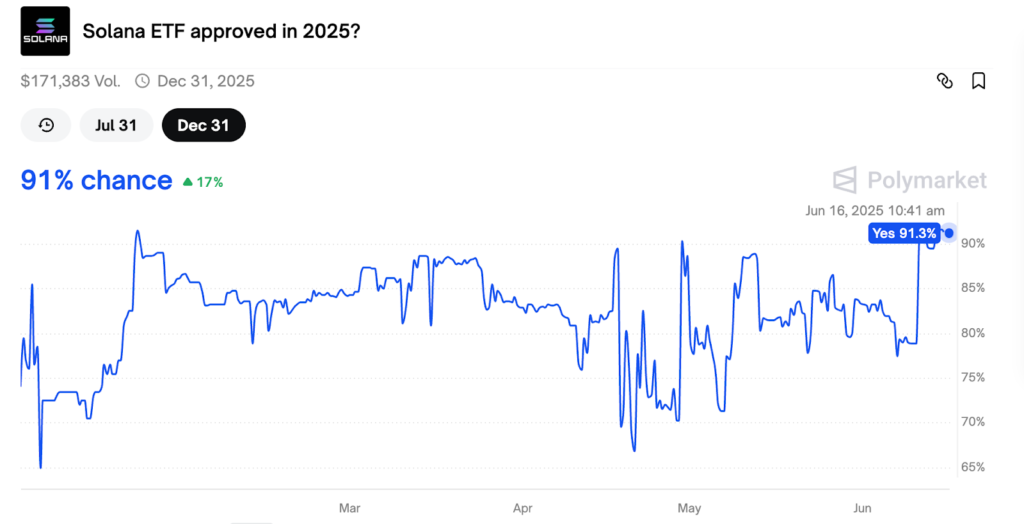
The biggest catalyst for SOL’s upward movement is the mounting speculation surrounding the approval of a spot Solana exchange-traded fund (ETF) in the United States. According to Bloomberg analysts, the U.S. Securities and Exchange Commission (SEC) could “act early” on Solana and staking ETF applications, significantly increasing market optimism.
On prediction platform Polymarket, the probability of ETF approval rose to 91% on June 16, up from 77.5% just ten days earlier. This dramatic rise in expectations came after seven major asset managers, VanEck, Grayscale, 21Shares, Bitwise, Canary Capital, and Franklin, filed S-1 forms with the SEC, signalling strong institutional intent.
Adding to the institutional momentum, investment firms Invesco and Galaxy Digital have declared their plans to launch a Solana ETF Trust in Delaware. Analysts suggest that if these funds are approved, they could unlock massive institutional capital inflows and push SOL to new all-time highs. Some forecasts even place long-term targets at around $1,300.
Derivatives Market Signals Institutional Confidence
The derivatives market is reinforcing the bullish sentiment. On June 12, open interest (OI) in SOL futures hit 45.87 million SOL, the highest in over two years. As of June 16, the OI remains elevated at 43.86 million SOL, equating to $6.86 billion. This makes Solana the third most sought-after asset in crypto derivatives, with demand surpassing even XRP by over 71%.

Such high open interest levels typically signal increasing institutional participation and confidence. The current trend suggests that large players are placing leveraged bets on SOL’s continued price rise. On exchanges like Binance, the long/short ratio remains tilted in favour of bullish positions.
However, this surge in open positions also introduces some downside risk, particularly in the form of potential liquidations if prices were to reverse sharply. Despite this, the sustained high OI reflects investor confidence in Solana’s bullish trajectory.
Technical Analysis: Bull Flag Targets $315
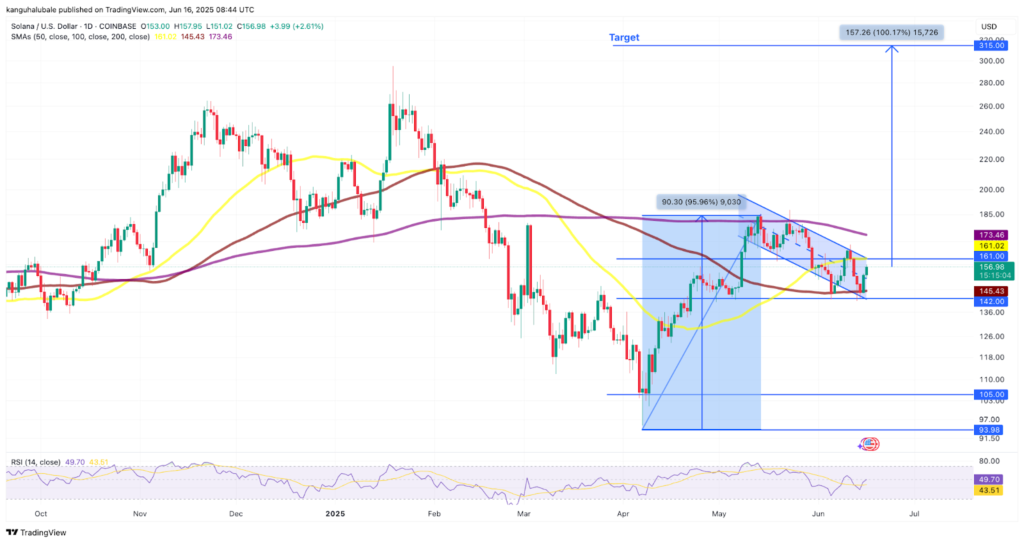
Technical indicators also support the bullish case. SOL has formed a bull flag pattern on the daily chart, a formation that typically signals a continuation of an uptrend. The flag pattern has developed following a sharp price rise and is characterised by a down-sloping consolidation range.
If the price breaks above the upper trendline of this pattern, it could rise by as much as the height of the previous rally, setting a technical price target of around $315, representing a near-100% gain from current levels.
The Relative Strength Index (RSI) also moved upwards, climbing from 38 to 50 between June 14 and June 16, indicating increasing bullish momentum. However, for this breakout to be confirmed, SOL must first flip the 50-day simple moving average at $161which, which aligns with the bull flag’s upper boundary, into a firm support level.
Market Sentiment Remains Strong
Overall sentiment around Solana is increasingly positive, driven by a mix of regulatory optimism, institutional interest, and bullish technical indicators. The potential approval of a Solana ETF could act as a significant turning point, attracting mainstream and institutional investors who were previously sidelined due to regulatory uncertainty.
As the crypto market continues to mature, projects like Solana that show strong developer activity, scalable infrastructure, and institutional backing are likely to benefit the most. For now, the spotlight remains firmly on SOL as traders and investors alike watch for further developments in the ETF approval process and technical breakouts in the price chart.
Leave a Reply