
Bitcoin has been trailing behind Ethereum and other major altcoins in recent weeks, but a new set of technical and on-chain indicators is hinting that the leading cryptocurrency may be preparing for its next major move. Despite being around 7% below its all-time high, data suggests that a bullish breakout is forming, driven by easing whale pressure, increased long-term holder accumulation, and strong technical support levels.
Whale Selling Pressure Begins to Ease
One of the main factors weighing on Bitcoin’s price in August has been persistent selling from whales, large holders who exert considerable influence over market direction. For much of the month, these investors were reallocating capital into alternative assets, leaving retail buyers to sustain Bitcoin’s price action.
However, new data shows that this trend is starting to reverse. The Exchange Whale Ratio, a metric that tracks the proportion of top 10 exchange inflows compared to all inflows has dropped from 0.54 on 19 August to 0.43 on 22 August, marking its lowest point in nearly two weeks.
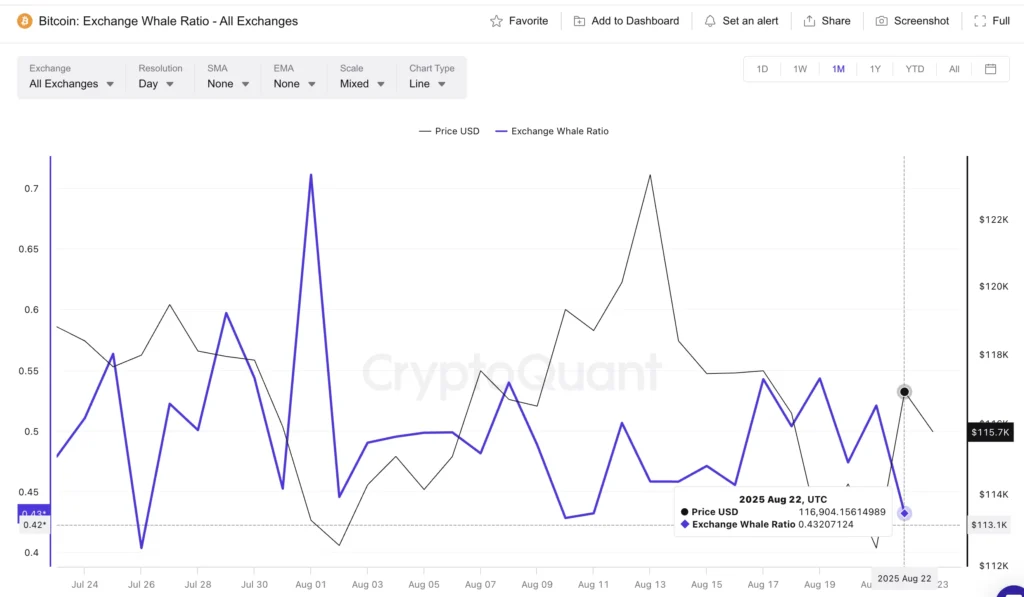
A similar scenario unfolded on 10 August, when the ratio dipped to 0.42. That decline was quickly followed by a rally that lifted BTC from $119,305 to $124,000, a nearly 3.9% gain. If history rhymes, the current weakening of whale selling pressure could open the door for a comparable price move, putting Bitcoin firmly back on track towards its previous highs.
HODL Waves Signal Strong Accumulation
Beyond whales, another critical question for BTC is whether mid-term and long-term holders are continuing to accumulate during this period of volatility. The HODL Waves metric, which analyses Bitcoin’s supply distribution across different holding durations, offers a clear answer.
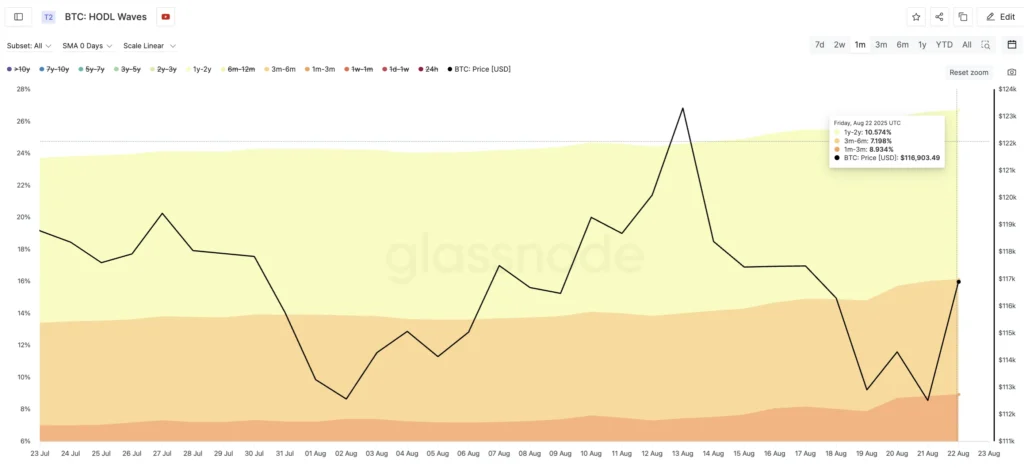
Over the past month, several key cohorts have expanded their positions:
- 1y–2y wallets increased from 10.31% to 10.57%
- 3m–6m wallets rose from 6.40% to 7.19%
- 1m–3m wallets climbed from 6.99% to 8.93%
This broad-based accumulation shows growing conviction among holders who historically provide stability to Bitcoin markets. When paired with easing whale flows, it suggests that the market is quietly building a foundation for the next leg higher.
Key Price Levels to Watch
While on-chain data paints a constructive backdrop, the technical chart adds precision to the short-term outlook. Bitcoin is currently trading near $115,700, slightly above strong support at $115,400. The next major test lies at $117,600, followed by a crucial breakout trigger at $119,700.
If the exchange whale ratio pattern seen earlier this month repeats, Bitcoin could climb nearly 4% from current levels, pushing it beyond $119,000 and into breakout territory. Such a move would likely set the stage for a retest of its all-time high, reigniting broader market momentum.
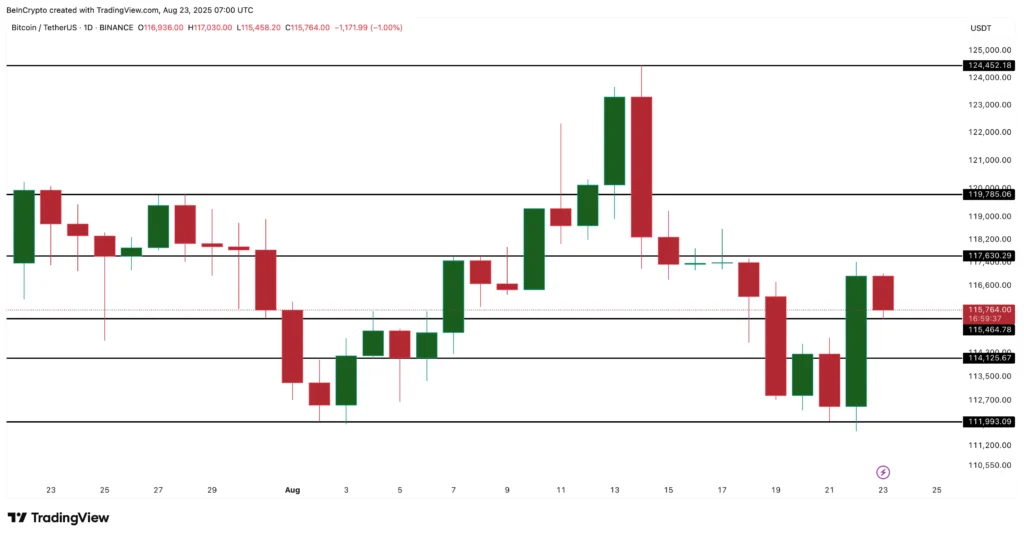
Conversely, downside risks remain. A slip below $114,100 would weaken the bullish case, while a drop under $111,900 could tilt momentum towards a bearish short-term outlook.
A Delayed, Not Denied Rally
Ethereum and other altcoins may have stolen the spotlight with fresh highs in recent weeks, but Bitcoin’s setup suggests its rally has only been delayed, not denied. With whale selling abating, HODLer accumulation strengthening, and key resistance levels within striking distance, conditions appear favourable for a breakout.
If confirmed, this move could validate the view that Bitcoin’s price action in August was more about consolidation than weakness, laying the groundwork for an eventual push to new highs.
For investors, the coming days may prove decisive in determining whether Bitcoin’s latest accumulation phase transforms into a sustained bullish trend.
Leave a Reply