XRP is showing signs of weakness after a sharp rebound from April lows, with analysts warning of a possible 16% price drop if key support fails to hold. The cryptocurrency is currently trading at $2.33 on May 27, recovering more than 45% from its April 7 low but still lagging 31% below its January 2025 peak of $3.40. With institutional interest fading and bearish patterns emerging, XRP may be heading for further downside in the near term.
Bearish Sentiment Grows in Derivatives Market
XRP’s derivatives market suggests a lack of strong bullish conviction. Funding rates in XRP perpetual futures contracts have remained near 0% since February, indicating a balance between long and short positions with no clear directional bias. Such neutrality often leads to price consolidation or sideways movement.
Compounding the uncertainty, open interest (OI) in XRP futures has dropped 9.6% from its three-month peak, falling from $3.52 billion on May 13 to $3.2 billion. This decline in OI is significant, as it suggests waning enthusiasm among traders. When open interest falls, especially after a price rally, it often signals that the upward momentum is unsustainable, and any selling pressure could trigger rapid declines due to the unwinding of leveraged positions.
Institutional Investors Pull Back
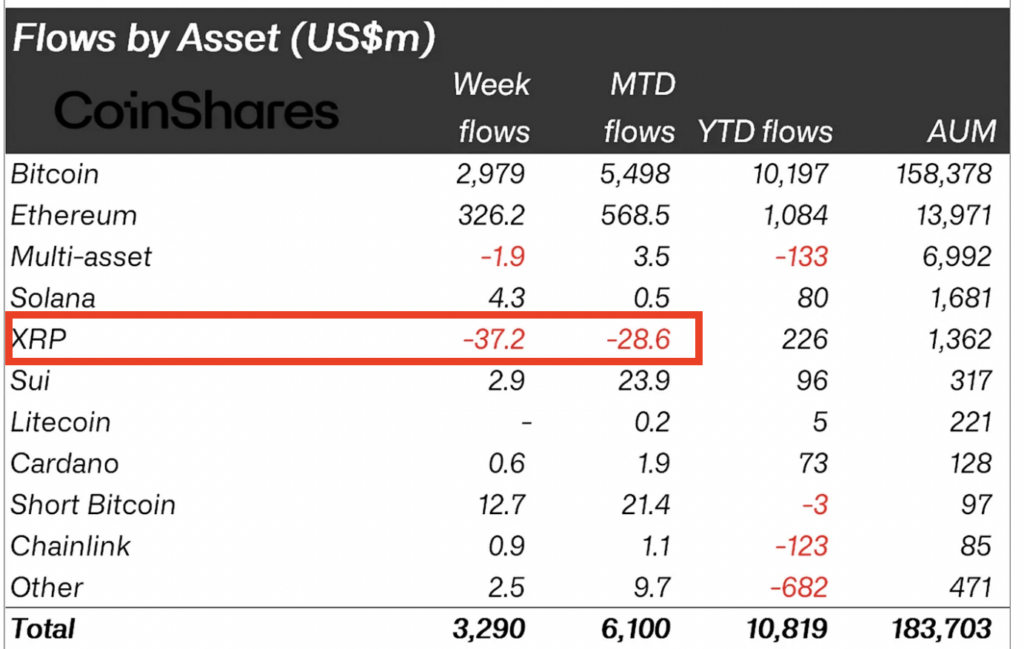
Further weakening XRP’s bullish case is the clear retreat by institutional investors. According to CoinShares, XRP-linked exchange-traded products (ETPs) saw outflows of $37.2 million in a single week, marking the end of an 80-week streak of inflows. This also brings total outflows for the month to $28.6 million.
In contrast, major cryptocurrencies like Bitcoin, Ethereum, and Solana continue to attract significant capital, recording inflows of $2.9 billion, $326 million, and $4.3 million respectively over the same period. The divergence highlights a shift in institutional sentiment, with XRP now out of favour among large-scale investors. This trend poses a risk to XRP’s price, especially if retail traders also begin to de-risk.
Technical Pattern Signals Potential 16% Drop
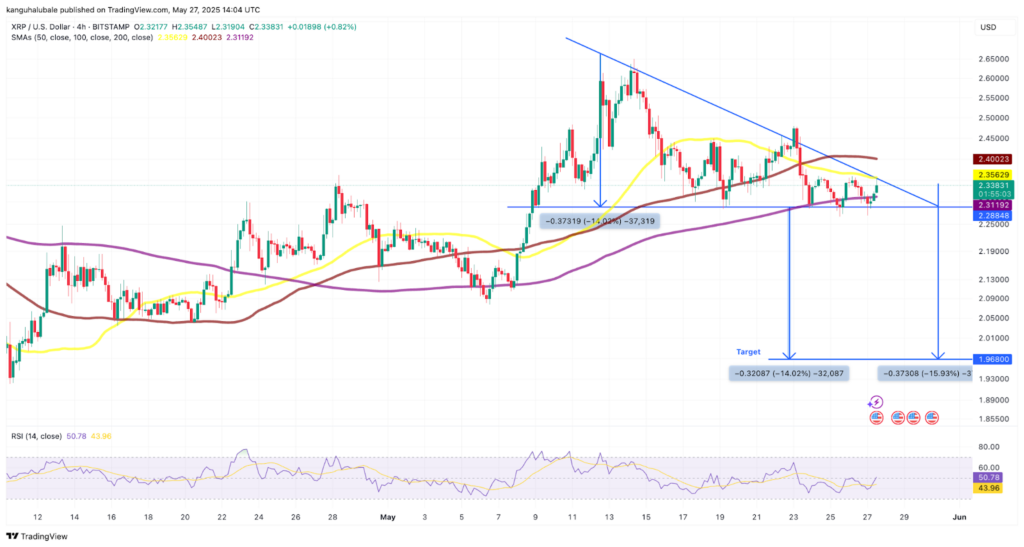
A descending triangle pattern forming on XRP’s four-hour chart since May 14 points to a possible bearish breakout. The chart shows a flat support level at $2.28 and a downward-sloping resistance line, a typical setup for a bearish reversal following an uptrend.
Currently, XRP is struggling to maintain support at the 200-day Simple Moving Average (SMA), which sits at $2.31. A decisive close below this level could push the price to test the triangle’s support line at $2.28. If this support breaks, analysts predict a further drop to the pattern’s downside target near $1.96 — a 16% decline from current levels.
This analysis aligns with earlier predictions that warned of a deeper fall toward $1.61 if key support zones do not hold.
A Potential Reversal Still on the Cards
Despite the growing bearish pressure, there remains a slim chance for a bullish reversal. A breakout above the descending triangle’s resistance line — currently near the 50-day SMA at $2.35 — would invalidate the bearish pattern. If that occurs, XRP could regain momentum and attempt a rally toward the psychologically important $3.00 level.
However, such a move would require a resurgence in trading volume and investor interest, both of which appear to be lacking at the moment.
Outlook: Bears in Control Unless Support Holds
In summary, XRP’s price is at a critical juncture. The combination of weakening derivatives signals, declining institutional interest, and a bearish chart pattern points to possible further losses. If support at $2.31 breaks, a decline toward $1.96 appears likely. Bulls must defend this level and push above $2.35 to shift momentum back in their favour. Until then, XRP holders may need to brace for continued volatility and downside pressure.
Leave a Reply