
XRP Price Analysis: Will the Market See Another Drop?
XRP has experienced a pullback following its recent rally, with signs suggesting the price may be topping out. The cryptocurrency recently dropped 4% in value, trading as low as $3.02 on January 29. Market indicators now suggest the possibility of a further decline, even as a potential bullish target of $4.60 remains in play.
Potential Breakdown Toward $2.50
A symmetrical triangle pattern on XRP’s chart suggests the possibility of a significant move in either direction. The formation, marked by converging trendlines connecting higher lows and lower highs, typically signals market indecision but can lead to a breakout once a direction is established.

At present, XRP is trading close to the triangle’s lower trendline. If this level is breached, the price could see further downside, potentially dropping toward the 50-day exponential moving average (EMA) at $2.57 or even reaching the bearish target of $2.50. Such a move would mark an 18% decline from current price levels.
This downside target is calculated by subtracting the triangle’s maximum height from the breakdown point near $3.00. However, should XRP break above the upper trendline, the price could surge towards $3.75, representing a more bullish scenario.
Declining Active Addresses Suggest Bearish Pressure
A key concern for XRP’s outlook is the declining number of active wallet addresses. Data indicates that XRP active addresses have fallen sharply, from a three-year high of 108,771 on December 2, 2024, to just 40,292 on January 28, 2025. This represents a staggering 39% drop over the past month and coincides with a 10% price decline over the last ten days alone.
The data suggests that many XRP holders have been taking profits following the cryptocurrency’s rise to a seven-year high of $3.40. If this trend persists, XRP’s price could continue to decline before finding a solid support level.
Bullish Continuation Remains a Possibility
Despite the bearish signals, XRP still exhibits characteristics of a bull flag formation, indicating a potential continuation of its upward trajectory. The bull flag pattern emerged following XRP’s rally from $2.27 to a local high of $3.40 between January 10 and January 16. The subsequent consolidation phase has seen XRP trade within a descending parallel channel, with the price now approaching key support levels.
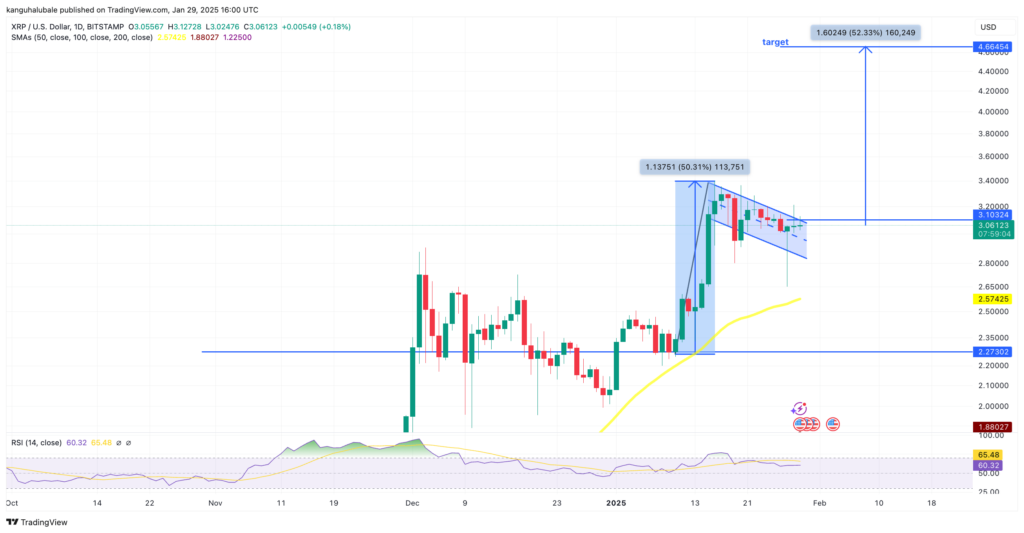
A breakout above the upper boundary of the flag at $3.30 could spark another rally, potentially sending XRP towards $4.60. This target is derived from the height of the previous rally, representing a potential 52% surge from current levels.
What’s Next for XRP?
The coming days will be crucial in determining XRP’s next move. If the price holds above key support levels, bullish momentum could return, pushing the cryptocurrency towards new highs. However, if selling pressure persists and active addresses continue to decline, a further drop toward $2.50 remains a strong possibility.
Investors should closely monitor market conditions, keeping an eye on both technical levels and fundamental data before making any trading decisions.
Leave a Reply