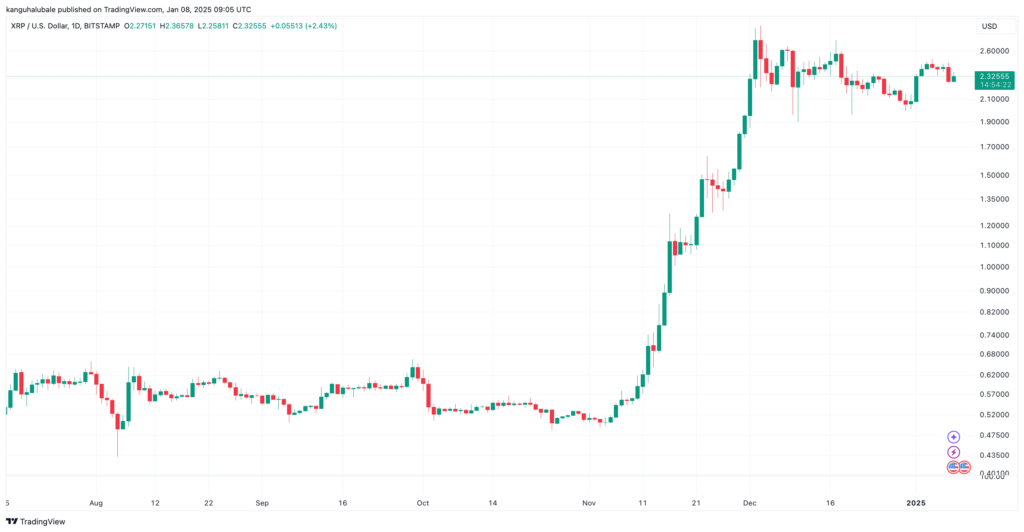
XRP has seen a sharp decline of 4.8% over the past 24 hours, trading at $2.31. This drop mirrors a broader downturn in the cryptocurrency market, where the total market capitalisation has fallen by 6.5% to $3.35 trillion. Several on-chain metrics and technical indicators point to a bearish outlook for the altcoin.
Massive Long Liquidations Fuel XRP Decline
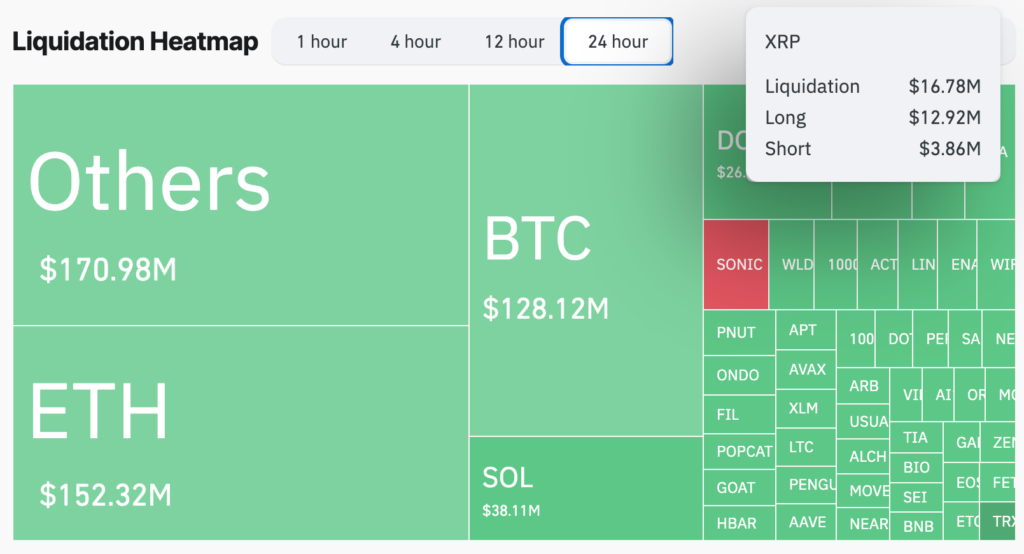
Data from CoinGlass reveals that over $12.92 million worth of long positions in XRP futures were liquidated in the past day, compared to just $3.86 million in short liquidations. This liquidation surge indicates intense sell-side activity, contributing to downward pressure on XRP’s price.
Long liquidations often force traders to sell their positions, amplifying price declines. A similar event occurred between 18 and 20 December, when $72.6 million in long liquidations led to a 23% drop in XRP’s price, bottoming out at $1.95.
Additionally, XRP’s funding rates have turned negative, dropping from 0.21% per week on 7 January to -0.11% per week on 8 January. Negative funding rates reflect reduced demand for long positions and a rising preference for shorts among traders. Open interest in XRP futures has also decreased by $300 million over the past day.
Offloading by Long-Term Holders
Long-term XRP holders have intensified selling activity since 4 January, further dampening bullish momentum. Data from Santiment shows that XRP’s dormant circulation supply—tokens unmoved for a year or more—jumped from 8.3 million on 4 January to 208.3 million on 7 January. This suggests long-term holders offloaded over $467 million worth of XRP in just three days.
The spike in dormant circulation supply has added significant selling pressure, coinciding with a 7.2% decline in XRP’s price since 4 January.
Technical Setup Signals Key Support Levels
XRP’s recent price movements are part of a broader correction that began on 3 December when the relative strength index (RSI) entered overbought territory, peaking at $2.90. The upper boundary of the descending parallel channel, currently at $2.45, remains a crucial resistance level. Bulls must flip this level into support to reverse the bearish trend.
If XRP fails to hold above $2.15, supported by the 50-day simple moving average (SMA), sellers may increase their activity, potentially pushing the price down to the lower boundary of the descending channel at $2.00.
The RSI, currently near the midline at 53, suggests a consolidating market, with room for a breakout in either direction. A break above $2.45 could pave the way for a bullish move toward price discovery.
Outlook for XRP
Despite the recent downturn, some analysts remain optimistic about XRP’s long-term prospects. One such analyst, Steph Is Crypto, believes XRP could still break out of its current bull flag pattern and rally to $5.60 in the future. For now, XRP traders will need to closely watch key resistance and support levels to determine the coin’s next move.
Leave a Reply