
XRP Bulls Aim to Reclaim Key Support Level
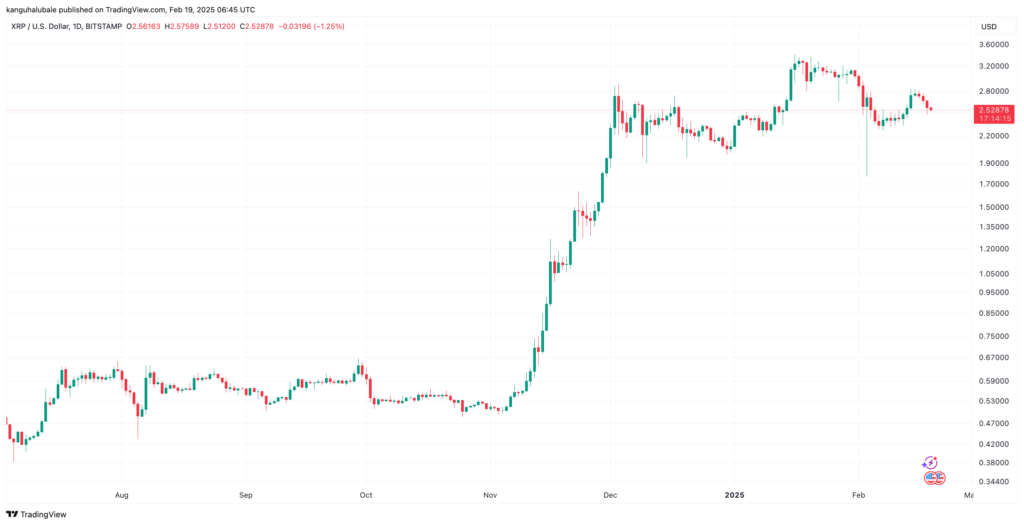
XRP’s price has experienced a significant decline from its recent high of $2.83 on 15 February, breaking below key support levels and raising concerns among traders about further downturns. The altcoin has now lost the crucial 50-day simple moving average (SMA) for the second time in two weeks, a development that could determine its next price direction.
Reclaiming the 50-Day SMA is Crucial
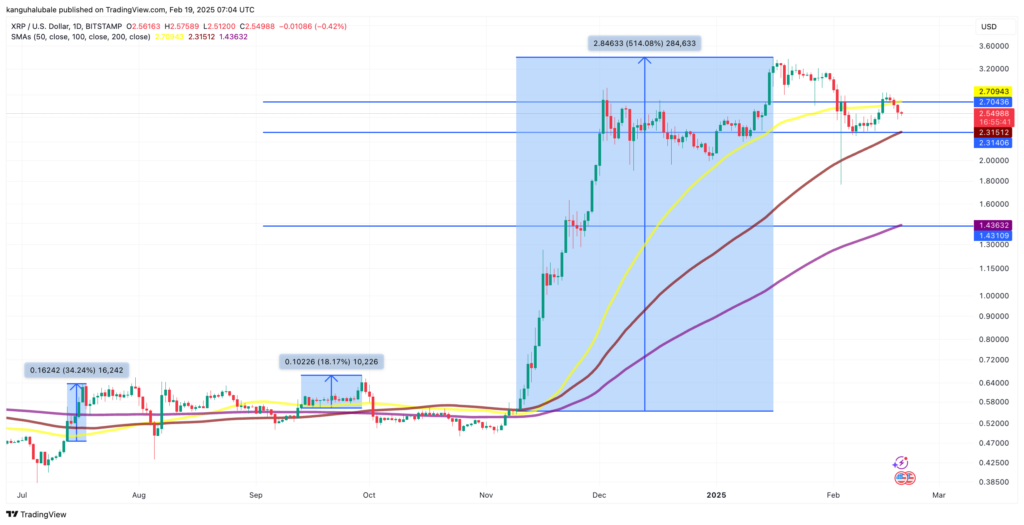
XRP’s recent price drop saw the asset fall below the 50-day SMA at $2.61, closing at $2.57. This moving average had acted as a support level since 10 November 2024.
The altcoin previously fell below the 50-day SMA on 2 February, dropping from a high of $2.95 before briefly reclaiming support on 14 February. However, it failed to maintain this level, raising concerns about deeper price corrections.
Historical data suggests that regaining the 50-day SMA could trigger a significant rally. For instance, on 10 November 2024, XRP reclaimed this level after trading below it for over a month, leading to a 500% surge in price. Similar breakouts in July and September 2024 resulted in 35% and 18% gains, respectively.
Crypto analyst MackAttackXRP noted on X that XRP is currently testing support at $2.40, suggesting that a move above the 50-day SMA could indicate a potential rally. Their analysis also suggests that XRP’s long-term trading range could fluctuate between $1.20 and $4.20.
Bearish Signals Point to Potential Correction
Despite attempts at consolidation, technical analysis indicates that XRP remains within a bearish continuation pattern, increasing the likelihood of further corrections.
XRP is currently trading within a bear flag formation, a pattern that suggests the possibility of extended downward momentum if critical support levels fail to hold.
- The bear flag emerged after XRP dropped from $3.13 to a local low of $1.76 between 31 January and 3 February.
- The ongoing consolidation within this pattern has XRP trading in an ascending parallel channel, with the recent drop testing key support at $2.50.
- A breakdown below this level could trigger another substantial price decline.
The bear flag’s downside target, based on the height of the previous drop, is approximately $1.73—a 32% decrease from current levels.
Popular crypto analyst CrediBULL Crypto has echoed this sentiment, suggesting that after failing to hold above the 50-day SMA, XRP could continue its downward trend toward $1.77.
What’s Next for XRP?
XRP’s immediate future depends on whether bulls can reclaim the 50-day SMA. A successful move above this level could signal a strong rally, while continued rejections may push the price further down towards the $1.70 range.
With bearish indicators still in play, traders remain cautious, closely monitoring support levels for any signs of reversal.
Leave a Reply